

Marine litter levels are still high, some positive signs are seen
| Indicators | Arctic Waters | Greater North Sea | Celtic Seas | Bay of Biscay and Iberian Coast | Wider Atlantic | OSPAR Maritime Area | Threshold Values |
|---|---|---|---|---|---|---|---|
| (Region I) | (Region II) | (Region III) | (Region IV) | (Region V) | |||
| Beach litter | 252 | 205 ↓ | 278 ↓ | 360 ↓ | 50 ↓ | 252 ↓ | 20/100 m |
| S: 2018-2020 | |||||||
| T: 2015-2020 | |||||||
| Items/100 m | |||||||
| Seafloor | n/av | 69 ↑ | 55 | 85 | n/av | n/av | n/av |
| S&T: 2012-2019 | |||||||
| % probability | |||||||
| Fulmar | N/A | 51 ↓ | N/A | N/A | N/A | N/A | 10% (OSPAR) |
| S&T: 2009-2018 | |||||||
| % of birds | |||||||
| Turtles | N/A | N/A | N/A | 9.6 | 16.3 | N/A | N/A |
| S: 2013-2019 | |||||||
| Pieces/turtle |
Key:
Year(s)
S= State Measurement
T= Trend Measurement
↑: upward significant trend ↓: downward significant trend
If no arrow there are no significant trends
Beach litter TV (20 items/100 m) is only relevant for EU Member States
[1] In addition: 16,3 pieces per turtle were found in Macaronesia (Canary Islands— outside OSPAR Maritime Area)[1] In addition: 16,3 pieces per turtle were found in Macaronesia (Canary Islands— outside OSPAR Maritime Area)
Overall confidence level for the thematic assessment on Marine Litter, building on the pressure section:
Mostly medium to robust ratings for type, amount, quality and consistency of evidence; however, there are regional differences with respect to data availability. Region II has the highest coverage of indicators and robust evidence but with medium degree of agreement (assessment results mostly in consensus but with some deviation). Regions III and IV have lower coverage, with medium ratings for type, amount, quality and consistency of evidence and for degree of agreement. Limited evidence and degree of agreement in Regions I and V.
Table P.2: Confidence
| OSPAR Region | Arctic Waters (Region I) | Greater North Sea (Region II) | Celtic Seas (Region III) | Bay of Biscay and Iberian Coast (Region III) | Wider Atlantic (Region V) |
|---|---|---|---|---|---|
| Confidence | Low | High | Medium | Medium | Low |
Input of litter (solid waste matter, including micro-sized litter)
Land and sea-based macro and microlitter exert pressures on the marine environment through distribution along the coastline, in the water column and on the seabed. It can impact animals through ingestion, entanglement and smothering or adversely affect human activities such as tourism and leisure, fishing and aquaculture. The pressure of marine litter on the OSPAR Maritime Area is periodically monitored through four common indicators: beach litter, plastic particles in the stomachs of fulmars (Region II only), seabed litter, and ingestion of plastic particles in turtles (Regions IV and V only). A number of selected other OSPAR and non-OSPAR, often qualitative, assessments, give additional information on pressure, where this is not covered by the common indicators, for example on microplastics and riverine litter. These also cover OSPAR Regions like the Arctic Waters or the Wider Atlantic.
Marine litter indicators have been dealt with as pressure indicators. However, in some cases, they could also be seen as state indicators, as with the common indicators "Plastics in the stomachs of fulmars” and "Ingestion of plastic particles in turtles".
Beach litter
Key message: Beach litter levels remain high, with plastic items predominating. Over the last six years, significant decreases in litter and plastic abundance have been observed at the OSPAR Maritime Area scale and in four OSPAR Regions. To substantially reduce marine litter, it is necessary to continue current efforts and take additional measures.
Scope
The beach litter common indicator reflects spatial differences and temporal changes in the abundance, composition, and sources of marine litter in the coastal environment and is used as a proxy for litter pollution in the OSPAR marine environment.
OSPAR’s Beach Litter Assessment describes the beach litter quality status and trends for both the OSPAR Regions and the OSPAR Maritime Area over the period from 2015 to 2020.
Figure P.1: Locations of the 114 OSPAR survey sites considered in the assessment. Available via: ODIMS
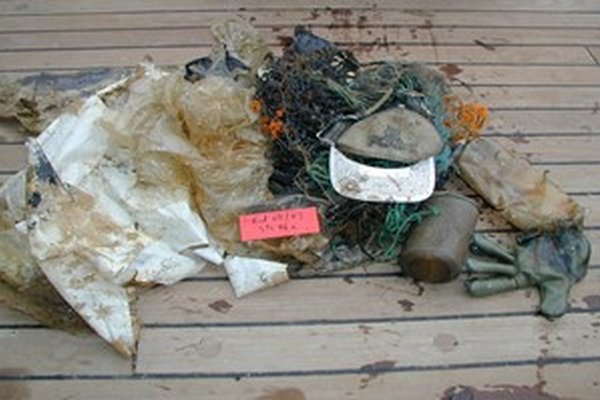
 (Litter collected on beach FR002, “Le Stang”, France, Bay of Biscay region, on 09/01/2020, photo by Cedre)")
Examples of litter collected during an OSPAR beach litter survey (bottom) (Litter collected on beach FR002, “Le Stang”, France, Bay of Biscay region, on 09/01/2020, photo by Cedre)
Assessment methodology
The assessment of beach litter pollution is based on a time-series of abundance of litter categories, individual litter types, groups of litter types and a total count of litter items recorded on 114 OSPAR beach litter survey sites in all OSPAR Regions.
To provide a snapshot of the current situation, litter abundance and composition were assessed from 2018 to 2020 and current trends were assessed over a six-year period from 2015 to 2020. The surveys were carried out according to OSPAR’s Coordinated Environmental Monitoring Programme guidelines for marine monitoring and assessment of beach litter and reported in the OSPAR Beach Litter Database. Non-identifiable mesoplastic fragments (less than 2,5 cm), waxes and other pollutants are excluded.
Assessment results
The median2 total count for the OSPAR Maritime Area between 2018 and 2020 was 252 items/100 m. Although no operational total abundance objective has yet been adopted at the OSPAR level, this value is much higher than the European beach litter threshold value (EU TV) of 20 items/100 m. The magnitude of beach litter pollution varies between the five OSPAR Regions from 50 to 360 items/100 m, the minimum being in the Wider Atlantic and the maximum in the Bay of Biscay and Iberian Coast Region (Figure P.2 and Table P.3). The composition of the litter includes very high proportions of plastic items, a predominance which is also observed at OSPAR Regions scale, where this material group always represents more than 92% of beach litter pollution.
Single-use plastics (SUP) and litter items related to maritime activities (SEA) are of great interest, since these usage categories are partly targeted by the EU intention to reduce the impact of certain plastic products on the environment. The SUP category includes specific litter items that are also directly targeted by the OSPAR Regional Action Plan on Marine Litter (RAP-ML 2014-2020). In the OSPAR Maritime Area, the median numbers for SUP and SEA usage groups are 45 items/100 m and 36 items/100 m, respectively (Table P.4). Overall, these groups represent respectively 26% and 21% of litter observed. The highest percentage of SUP is observed in Bay of Biscay and Iberian Coast (37%), whereas the highest percentage of SEA items is observed in the Greater North Sea (25%). SUP and SEA items are directly targeted by government measures and are expected to decrease in coming years.
Over the last six years, decreasing trends in total and plastic counts have been observed at the OSPAR area scale and in all Regions except in Arctic Waters, where robust results could not be obtained due to low data availability. However, these decreasing trends appear to be rather slight, with decreases in total count ranging from 9 to 12 items/100 m (Table P.3). Decreasing trends have also been observed for SUP and SEA in the Greater North Sea, Celtic Seas and Bay of Biscay and Iberian Coast Regions, but with slopes ranging from –2 to –5 items/100 m per year (Table P.4).
In the present assessment, high confidence is expressed in both the methodology and the data availability, except for the Arctic Waters Region, where data are too limited, especially for trends assessment.
Figure P.2: Median total counts in the five OSPAR Regions over the three-year period from 2018 to 2020. Available via ODIMS
Table P.3: Median total and plastic counts (from 2018 to 2020) and associated trends (from 2015 to 2020) in the OSPAR Area and Regions.
Geographical scale | Median total count | Trend ↓ significant decrease ↑ significant increase | Median plastic count | Trend ↓ significant ↑ significant | |
OSPAR Area | 252 | ↓ -11 | 194 | ↓ -9 | |
Arctic Waters | 252 | -6a | 172 | -16a | |
Greater North Sea | 205 | ↓ -9 | 161 | ↓ -8 | |
Celtic Seas | 278 | ↓ -12 | 145 | ↓ -11 | |
Bay of Biscay and Iberian Coast | 360 | ↓ -11 | 284 | ↓ -11 | |
Wider Atlantic | 50 | ↓ -11 | 35 | ↓ -11 | |
a trend slopes provided for information (lower confidence due to a limited number of sites and / or surveys) |
| ||||
Table P.4: Median counts in Single-use plastics (SUP) and Maritime-related plastic items (SEA) (from 2018 to 2020) and associated trends (from 2015 to 2020) in the OSPAR Area and Regions.
Geographical scale | Median SUP count | Trend ↓ significant decrease ↑ significant increase | Median | Trend ↓ significant decrease ↑ significant increase | |
OSPAR Area | 45 | ↓ -4 | 36 | ↓ -2 | |
Arctic Waters | 30 | -4a | 30 | -5a | |
Greater North Sea | 37 | ↓ -4 | 40 | ↓ -2 | |
Celtic Seas | 37 | ↓ -5 | 29 | ↓ -2 | |
Bay of Biscay and | 93 | ↓ -4 | 51 | ↓ -4 | |
Wider Atlantic | 6 | 0 | 1 | 0 | |
a trend slopes provided for information (lower confidence due to a limited number of sites and / or surveys) | |||||
Conclusions
Beach litter is abundant in the OSPAR Maritime Area and in the OSPAR Regions. Plastic appears to be predominant in all OSPAR Regions. Single-use plastics and maritime-related litter are important components of beach litter pollution at the OSPAR level, though some regional specificity in proportions of these two groups of litter is observed. At present, an important reduction in abundance is required at the OSPAR level to reach, for example, the threshold value of 20 litter/100 m adopted at the EU level. Significant decreasing trends are observed in all regions (except in Arctic Waters where they could not be assessed robustly), especially for total counts and plastics. However, levels of marine litter remain high. Overall, and in view of the observed trends, results show that current measures should be continued and strengthened and that additional measures need to be taken to obtain a stronger reduction of beach litter in the OSPAR Maritime Area in order to substantially reduce beach litter pollution and achieve OSPAR objectives, especially objective S 4.O3 recently adopted in the NEAES 2030. This objective aims to reduce “by at least 50% the prevalence of the most commonly found single-use plastic items and of maritime-related plastic items on beaches in order to contribute to the achievement of relevant regional and EU threshold values building upon requirements for EU Member States in the EU Single-Use Plastics Directive (Directive 2019/904), and by at least 75% by 2030."
Seafloor litter
Key message: Seafloor litter is widespread across the area assessed; fisheries-related items and plastic materials predominate. The Bay of Biscay and the Iberian Coast had a higher probability of litter collected than both the Greater North Sea and Celtic Seas. In the Greater North Sea, the probability of litter collected has increased.
Scope
The seafloor is a sink for marine litter, as evidenced by research into both coastal and deep-sea waters using techniques such as snorkelling, scuba diving, trawl surveys and sonar, as well as manned and unmanned submersibles. The presence of large amounts of plastic litter has been reported on the European continental shelf. Benthic trawl surveys are a practical way to monitor seafloor litter on the continental shelf, because they are already in use for fish stock assessments, cover a wide area of seafloor and collect sufficient litter for analysis. There are some limitations to these data as the surveys’ priority is to assess fish stocks, rather than litter accumulation and trends. The trawls cover only soft sediment (there are sampling restrictions in rocky areas), small litter items are not collected and, although there has been significant work to improve the sampling, there are still concerns over the quality of the data submitted due to limited technical guidelines, differing mesh sizes in fishing nets and lack of quality control. How well the different types of gear sample litter is not well understood.
Marine litter by-catch on board the RV Endeavour. © J. Thain
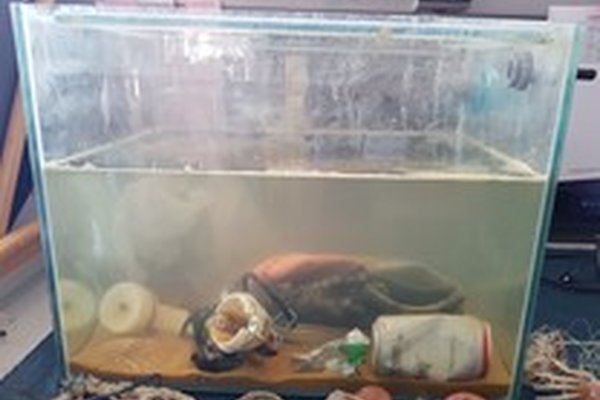
Display tank showing collected seafloor litter. © Cefas
Assessment method
This assessment is based on data collected in line with the guidelines established as part of the OSPAR Coordinated Environmental Monitoring Programme (CEMP). The assessment draws on 12 survey programmes in three OSPAR Regions (Greater North Sea, Celtic Sea and Bay of Biscay and Iberian Coast). To take into account specific variables including gear type, area swept and unequal sampling effort in a given space, a statistical modelling approach was adopted.
The main part of the assessment shows the modelled probabilities that hauls will contain litter for the selected years (2012 to 2019). These models focus on the presence or absence of litter collected for each haul. Counts are not used for the main part of the assessment as there is a lack of confidence in the data between Contracting Parties, because their interpretations of how to count items differ.
Results
Litter is widespread on the seafloor in the Greater North Sea, Celtic Seas and Bay of Biscay and Iberian Coast, with plastic the predominant material encountered (2012 to 2019). In spatial maps of the proportions of hauls containing litter items, separate assessments were made for each Region. In the Greater North Sea, there was a north-west (low) to south-east (high) gradient in probability that hauls would contain litter; in the Celtic Seas there was a north (low) to south (high) gradient. The combined probabilities for 2019 for some of these spatial gradients are shown in Figure P.3. Overall, the Bay of Biscay has the highest probability that a haul will contain a litter item (87%), with the Greater North Sea next (69%) and Celtic Seas the lowest (45%).
Map Legend:
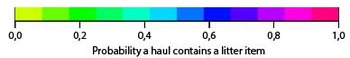
Figure P.3: Smoothed maps for the three regions (GNS, CS, and BB) combined for 2019 of the probability that hauls contain a litter item. Available via ODIMS
The Greater North Sea was the only area to show a slight but statistically significant increasing trend in probability that hauls would contain litter, for the period between 2012 (approximately 0,6) and 2019 (approximately 0,7). Although there appeared to be a potentially increasing trend for fishing litter, it was not statistically significant.
The items most commonly found in each Region over time were mainly either made of plastic (bags, caps, bottles, band, sheets) or related to fishing activities (synthetic rope, other rope, monofilament fishing line, tangled fishline, fishing net). Other items included clothing, processed wood, and drinks cans. The top ten lists were similar for each of the three OSPAR Regions assessed.
A United Kingdom case study which looked at the NS-IBTS survey of the Greater North Sea Region showed no clear temporal trend (2015 to 2020), although a trend is difficult to show for such a small number of years. The lowest counts were in 2015, rising in 2016 and then reducing over the next four years. The statistically significant spatial components in 2017 and 2018 reflected a similar change to that seen with the probabilities, with more items collected per unit effort in the south of the Greater North Sea.
On examination of the catchability assessments, it is clear that the type of gear affects the type of litter caught during a survey. Initial catchability ratios were calculated for the litter types in each region and show that more items are collected by beam hauls than by Grand Ouverture Verticale (GOV) hauls. For these gear types, the ratio for total litter collected per haul varied from 1:5 in the Greater North Sea and 1:12 in the Celtic Seas.
Conclusions
Some broad conclusions can be drawn concerning the spatial and temporal changes affecting the probability that a haul will contain litter in the Greater North Sea, Celtic Seas and Bay of Biscay and Iberian Coast, and a demonstration study of count data was carried out in the Greater North Sea. Catchability estimates can be given for the ratios between different types of gear. To make further progress it is important to ensure that all surveys provide reliable counts of litter items.
Modelling of the presence / absence data took into account potential biases caused by unequal sampling in space, area swept and gear type. However, it has been recognised that to be able to fully combine all the available data, there is need for greater understanding of how the types of gear are set up and how different countries have been interpreting the litter-counting guidelines. OSPAR will be drawing on the experience of fishing survey analyses to improve the modelling.
There is moderate confidence in both the methodology and the data availability.
Plastic particles in the stomachs of fulmars

Fulmar in flight, Scotland. Source: Lucy Ritchie
Key message:
Currently 51% of beached North Sea fulmars have more than 0,1 g of plastics in their stomachs, exceeding the Fulmar Threshold Value (Fulmar-TV) of 10%. This reflects the abundance of floating litter and provides an indication of harm. The amounts of ingested plastics have decreased significantly in the period 2009 to 2018.
Scope
Fulmars are abundant and widespread seabirds known to regularly ingest litter, with nearly all individuals having at least some plastic in their stomachs. Although fulmars forage at or near the water surface, their stomachs may also contain items from deeper water or items indirectly ingested through their prey.
The purpose of the Common Indicator on Plastic Particles in Fulmar Stomachs is to monitor the amounts of plastic particles ingested by the fulmar and to give an approximation of the amount of floating litter. These results are necessary for OSPAR reporting and for Marine Strategy Framework Directive (MSFD) reporting of litter ingested by marine animals (criterion D10C3).
Mostly the mesoplastics (0,5-2,5 cm) and large microplastics (1-5 mm) present in the stomach of the fulmar are assessed. Some macroplastics (e.g., filaments) may also be present. The total mass of the plastic particles in fulmar stomachs is assessed and the percentage of fulmars with more than 0,1 g of plastics in their stomachs is calculated. The threshold value for fulmar plastics was set at 10% by OSPAR in 2020, based on the study by Van Franeker et al., (2021). This determines that not more than 10% of the fulmars should have more than 0,1 g of plastics in their stomachs.
The fulmar indicator is applied in the OSPAR Greater North Sea Region. This Region consists of the five sub-regions English Channel, Skagerrak, East England, Scottish Islands, and South-eastern North Sea. Both the Greater North Sea Region and its sub-regions are assessed separately and provide information on different spatial scales and with different statistical power and significance. A recent OSPAR pilot study has shown that the fulmar indicator is applied in the Arctic Waters Region for monitoring by Iceland, and has been applied for research purposes by Denmark and Norway, respectively.
 and a mix of thread-like (centre left), sheet-like (centre), and fragmentary (right) consumer plastics. Size indicated by the spherical industrial granules, which are of 4 to 5 mm diameter. (Fulmar sample NEE-2018-017 photo by J.A. van Franeker).")
Plastics from a fulmar stomach with industrial granules (left) and a mix of thread-like (centre left), sheet-like (centre), and fragmentary (right) consumer plastics. Size indicated by the spherical industrial granules, which are of 4 to 5 mm diameter. (Fulmar sample NEE-2018-017 photo by J.A. van Franeker).
Assessment method
The plastic pollution status and trends relating to fulmar stomachs were assessed using the total mass of plastic particles (mostly pellets and non-identifiable mesoplastic fragments) per stomach.
For state assessment, the percentage of fulmars with more than 0,1 g of plastics in their stomachs was calculated by aggregation of the five most recent years of data (2014 to 2018). The state assessment values were compared to the Fulmar Threshold Value (Fulmar-TV).
For trend assessment, linear regression of ln-transformed total mass data per fulmar stomach was performed for the period 2009 to 2018.
These state and trend assessments were performed at the OSPAR Region II level as well as for its five sub-regions. See the CEMP Guidelines for monitoring and assessment of plastic in fulmar stomachs for full methodological details.
Results
State Assessment 2014-2018
Over the period 2014-2018, the OSPAR long-term goal in terms of plastic litter ingestion by seabirds was not reached anywhere in the Greater North Sea Region. Among the 393 fulmar stomachs analysed, 51% contained more than 0,1 g of plastic, whereas the aim of the Fulmar-TV is to reduce this to less than 10%. Of all birds analysed, 92% had ingested some plastic, and the average values per individual bird were 21 particles and 0,26 g. Regionally, the Fulmar-TV percentage ranged from 49% in the Skagerrak and on the Scottish Islands to 68% in the English Channel. Within the Greater North Sea Region, the earlier tendency for decreasing plastic loads further north became less clear. In previous assessments the English Channel had been significantly more polluted than the more northern sub-regions. This appeared to continue but not at a statistically significant level. Figure P.4 shows the sub-regional differences in ingested plastics in the Greater North Sea.
On the larger scale of the North-east Atlantic, a latitudinal pattern remains evident (Van Franeker et al., 2011; Van Franeker & Law 2015; Van Franeker et al., 2021). Only in the far north-western Atlantic (the Canadian Arctic) are the plastic ingestion levels, as expected, close to the Fulmar-TV. In the first assessment period 2010 to 2014 the numbers were 58% and 0,31 g. The 56% and 0,28 g calculated for the second assessment period 2012 to 2016 and the new values for the third period suggest a continued decrease, that however has to be evaluated in the agreed statistical approach.
Trend assessment 2009 to 2018
Time-related trends in the fulmar monitoring programme are tested over periods of 10 years. The first assessment for 2005 to2014 did not reveal any change. However, the second assessment for 2007 to 2016 showed a significant decline in the ingested plastic mass. In the 2009 to 2018 period the significant decline continued, but was less pronounced.
In contrast to earlier years, the reduction was driven by decreases in user plastics and, to less extent, by industrial plastics.
Statistically significant progress in the direction of the Fulmar-TV for the Greater North Sea Region as a whole was thus achieved. Four of the five trends for the separate sub-regions (Figure 1) showed no statistically significant changes. This illustrates the statistical advantage, for the regional North Sea assessment, of combining all samples from the different sub-regions.
There is high confidence in both the methodology and the data availability.
 in different sub regions of the North Sea over the period 2014 to 2018.")
Figure P.4: Proportions of fulmars having more than 0,1g plastic in the stomach (EcoQO performance) in different sub regions of the North Sea over the period 2014 to 2018.
Details of sample sizes and average number and mass of ingested plastics are shown in the full 2021 fulmar indicator assessment.
Conclusion
The indicator appears to move in the direction of fewer plastics in the North Sea marine environment, but still far exceeds the Fulmar-TV. The North Sea fulmar population has suffered substantial decline over the past decades. Although direct evidence for the causes of decline is not available, the ingestion of plastic litter is considered a potential contributing factor, because the sub-lethal effects of reduced body condition and health may affect almost all individuals in the population. Measures in the OSPAR Regional Action Plan aim to reduce litter and are expected to lead to a reduction of litter ingested by fulmars.
Ingestion of plastic particles in turtles
Key message: There is a high incidence of litter ingestion by sea turtles in the Bay of Biscay, the Azores and Macaronesia, but with regional differences. Mean abundance of ingested plastics was 9,6, 16,3 and 16,3 pieces, respectively. This new common indicator provides the baseline for further monitoring and evaluation of trends.
Sample of marine litter excreted by an individual loggerhead turtle (Caretta caretta) in a rescue centre (credit D. Gambaiani, Cestmed)
Plastic collected in the oesophagus of a necropsied loggerhead turtle (Caretta caretta) (Bay of Biscay). Source: La Rochelle aquarium
Scope
The amount of litter and microlitter ingested by sea turtles may indicate adverse effects on the health of these animals, which could eventually prevent obtaining a good environmental status. The assessment provides information about environmental status in southern OSPAR areas (Regions IV and V).
The wide distribution of sea turtles, their use of various marine compartments and their propensity to ingest debris make them a relevant indicator. Since the indicator was initially proposed in 2015, progress has been realised in terms of networking and the collection of standardised data to provide an assessment of the indicator in the southern OSPAR seas where sea turtles live. While Macronesia is outside the OSPAR Maritime Area, it nonetheless provides a useful case study.
Assessment method
The indicator focuses on the loggerhead turtle, Caretta caretta. The prevalence of litter ingestion in sea turtles is calculated as the percentage of dead turtles found with ingested litter, based on occurrence (or incidence) reported as presence or absence. While a precise definition of a threshold value is under review, the data collected provide the first assessment and supply important knowledge for measuring the impact of actions on single-use plastics and, more generally, for reinforcing measures related to the conservation of sea turtles.
According to the distribution of sea turtles, the monitoring is applicable to OSPAR Regions IV and V as well as Macaronesia. See the protocol elaborated within the MSFD and updated in the framework of the European Union INDICIT project for full methodological details.
Results
For this first assessment, 182 dead loggerhead turtles obtained from 1988 to the end of 2019 in the southern OSPAR area were necropsied to measure the prevalence of ingestion (% of individuals affected) and amount of litter ingested (dry mass and abundance of litter in the digestive tract).
A total of 52,5% of the turtles were found with ingested litter (plastics) in their digestive tract and, on average, 0,6 ± 0,1 g, equivalent to 13,1 ± 2,0 pieces, were found in each individual’s digestive tract. By only considering the data collected from 2013 to 2019 inclusive, which presented a more standardised collection of data in line with the MSFD protocol, the occurrence of litter ingestion increased to 68,1%, while the mean dry mass and the mean abundance of ingested plastics reached, respectively, 0,7 ± 0,22 g and 14,3 ± 6,7 pieces.
Considering the data from 2013 to 2019, among the three areas there was a significant difference in the occurrence of ingested dry mass, but no difference in numbers of items. The occurrence of plastic ingestion was lowest in the Bay of Biscay, at 47,6% (N=21), while it was 71,1% in the Azores (N=38) and reached 100% in the Canary Islands (N=10). The mean dry mass of ingested plastic was, respectively, 0,2 ± 0,1 g in the Bay of Biscay, 1,0 ± 0,3 g in the Azores, and 0,2 ± 0,1 g in the Canary Islands). The mean abundance of ingested plastics for these three regions was 9,6 ± 4,1 pieces; 16,3 ± 4,3 pieces; and 16,3 ± 3,1 pieces, respectively.
Table P.5: Mean prevalence (% of affected individuals), dry mass (g per individuals), and amount of litter ingested by sea turtles (abundance) in the southern OSPAR area; N = sampling size (INDICIT, 2021)
| Area | 2013-2019 | |||
| N | Prevalence | Dry mass | Abundance | |
| Biscay (OSPAR Region IV) | 21 | 47,6 | 0,2 ± 0,1 | 9,6 ± 4,1 |
| Azores (OSPAR Region V) | 38 | 71,1 | 1,0 ± 0,3 | 16,3 ± 4,3 |
| Canary islands (Macaronesia) | 10 | 100 | 0,2 ± 0,1 | 16,3 ± 3,1 |
| TOTAL | 69 | 68,1 | 0,7 ± 0,2 | 14,3 ± 6,7 |
, dry mass (g per individual X 100), and number of items ingested by sea turtles (abundance) in the Bay of Biscay, N = sampling size (after INDICIT, 2021)")
Figure P.5: Mean prevalence (% of affected individuals), dry mass (g per individual X 100), and number of items ingested by sea turtles (abundance) in the Bay of Biscay, N = sampling size (after INDICIT, 2021)
, dry mass (g per individual X 100) and number of items ingested by sea turtles (abundance) in the Azores; N = sampling size (INDICIT, 2021)")
Figure P.6: Mean prevalence (% of affected individuals), dry mass (g per individual X 100) and number of items ingested by sea turtles (abundance) in the Azores; N = sampling size (INDICIT, 2021)
, dry mass (g per individual X 100), and number of items ingested by sea turtles (abundance) in the Canary Islands, N = sampling size (after INDICIT, 2021)")
Figure P.7: Mean prevalence (% of affected individuals), dry mass (g per individual X 100), and number of items ingested by sea turtles (abundance) in the Canary Islands, N = sampling size (after INDICIT, 2021)
Conclusions
The first assessment of the Common Indicator “Litter ingested by sea turtles” indicates a high incidence of litter ingestion by sea turtles in OSPAR Regions IV and V and Macaronesia but with regional differences. It provides a first baseline for further monitoring and evaluation of trends. The approach will enable the evaluation of the efficiency of reduction measures, including some specific actions such as developing national strategies to tackle single-use plastics from the first OSPAR Regional Action Plan.
This initial assessment provides consistent data and the technical and scientific basis for future implementation of monitoring. Further sampling will also enable greater coverage which will record all stranded animals in all parts of Regions IV and V and Macaronesia. Long-term management of sampling and data collection will also enable the evaluation of trends. Alignment of the data with the threshold value preliminarily defined by the EU INDICIT project, which has yet to be agreed by OSPAR, indicates that the population of sea turtles in the OSPAR area is strongly affected by marine litter, and that reinforced and new actions are required.
Other (OSPAR) assessments
Microplastics
Microplastics pollution of marine environmental compartments is an issue of concern worldwide, but information on the key sources, pathways, distribution and impacts is still scarce in many cases, fragmentary at best and, typically, difficult to compare owing to a lack of harmonisation in methodologies.
Sources of microplastics in the OSPAR Maritime Area
Microplastics have been reported for sediments, water and biota globally including across the OSPAR Maritime Area. Sources of microplastics are varied and often difficult to identify due to their dynamic transport in the terrestrial, freshwater and marine environment and are mainly classified as land- and sea-based sources (Figure P.8). Land-based sources have been generally assumed to be the main contributors of plastic (macro) waste to the marine environment (Gilardi et al., 2020; Meijer et al., 2021), although sea-based sources are also recognised as an important contributor in the OSPAR area (GESAMP, 2021). For the OSPAR catchments, tyre wear and (macro) litter (breaking down into smaller pieces) were identified as the largest land-based sources of microplastics, with estimated amounts of around 100 000 tonnes per year (OSPAR, 2017). Sea-based activities also contribute to the global burden of microplastics, including fishing, aquaculture, shipping, ocean dumping and other marine activities. To date, estimates of the total contribution of sea-based sources to the OSPAR Maritime Area are not possible due to the limited available quantification of marine litter inputs from the scientific, peer-reviewed and grey literature (Gilardi et al., 2020).
")
Figure P.8: Overview of sources and pathways of microplastics to the marine environment identified in the scientific literature. (Modified from source: OSPAR, 2017.)
Occurrence and abundance of microplastics in the OSPAR Maritime Area
While monitoring data for microplastics are limited for the OSPAR Maritime Area, some data are available on their abundance in sediments (seafloor, subtidal, beach and estuaries), surface and near-surface waters, the water column and biota for various locations. A lack of standardised analytical and reporting protocols makes comparisons between datasets difficult. International efforts are currently being focused on the production of guidelines at national and international levels to produce monitoring data which can be used for national, regional, and sub-regional assessments. Microplastics have been reported for all the environmental compartments assessed (sediments, water, and biota) in all OSPAR Regions. A knowledge gap in monitoring data was identified for Region V, owing to a lower number of available studies reporting on the abundance of microplastics in the area. Reported concentrations of microplastics varied greatly according to the environmental compartment targeted and across locations. Reported polymer types appeared to be consistent across Regions, with a prevalence of polyethylene (PE), polypropylene (PP) and polyester (and, in addition, polystyrene (PS) and polyvinyl chloride (PVC) in sediments). The main reported types of microplastics were fibres and (or followed by) fragments.
. © Instituto Español de Oceanografía (IEO)")
Figure P.9: Photographs of different types of microplastics collected in seawater and sediments in Ría de Vigo (NW Spain). © Instituto Español de Oceanografía (IEO)
Summary and conclusions
Despite the absence of widely accepted, harmonised, protocols for the analysis of microplastics in environmental samples, there is a common consensus that microplastics are widely present in the marine environment. Microplastics have been reported in sediments (beach, estuarine, subtidal and seafloor), surface waters, the water column and biota for the OSPAR Maritime Area at different concentrations. However, the lack of applied standardised sampling and analytical protocols for the monitoring of microplastics makes comparison between datasets difficult, and a fully integrated qualitative assessment is not feasible.
There is, therefore, an urgent need to develop and adopt common indicators and supporting guidelines for the monitoring of microplastics in the OSPAR Maritime Area. Seafloor sediments have been identified as likely sinks for microplastics in the marine environment and work is ongoing to develop guidelines for their monitoring for the OSPAR Maritime Area which take into account future spatial and temporal assessments, better integration with the monitoring of other contaminants as well as an understanding of subsequent risks to marine life and impacts on key environmental processes (e.g., global nutrient cycle and oxygen levels in the ocean (Kvale et al., 2021)).
Riverine litter
One of the major pathways for litter to enter the marine environment is via terrestrial waterways, namely rivers and other tributaries. An overview has been prepared ( link to overview ) of the current state of knowledge on macroplastics export by six rivers in OSPAR Region II (Greater North Sea): Seine, Rhine, Meuse, Ems, Weser and Thames. A rudimentary estimate of total macroplastics export by these rivers to Region II is 10,5 – 220,6 tons per year (Figure P.10). Two main insights can be derived from comparing the observed amounts of macroplastics in rivers within the OSPAR area. First, the export of macroplastics by rivers in the OSPAR area varies greatly and, second, the estimated range of macroplastics exported is large, often showing a difference of one order of magnitude or more between the lower and the higher estimates. These large ranges are an indicator of the level of uncertainty that comes with these data.
Plastic is the predominant material type of macrolitter pollution found in all rivers (approximately 80%). Most of the items found in rivers can be linked to consumer use (such as bottles, plastic bags, food wrapping and sanitary items). However, the most frequently found items are unidentifiable small pieces of plastic of < 5 cm. The large presence of smaller pieces of plastic indicates that plastic items already experience breakdown processes within a river system (to a large degree through UV-light and wear and tear by wind, waves, and traffic). Long term, integrated monitoring strategies need to be developed in order to better quantify plastic pollution and to identify possible ways to reduce it. A number of riverine litter activities are foreseen in the revised OSPAR RAP ML. They are supported by the following operational objective in NEAES 2030:
"By 2025 OSPAR will develop approaches to prevent and reduce riverine marine litter inputs in cooperation with the relevant international river or river basin commissions, and other appropriate authorities and organisations.”
Any future work to address the issue of riverine litter as a source of marine litter in the North-East Atlantic will require close cooperation and collaboration with the various river commissions or the appropriate national responsible bodies. Furthermore, collaboration with the work underway at the EU level is essential to the success of any initiative or proposed way forward, including consideration and discussion of the benefits of a harmonised approach to monitoring.
")
Figure P.10: Overview of floating macroplastic exports from rivers located in the OSPAR area (no mass transport data for the Thames available)
Marine litter in the Arctic
Very little data are available on the Arctic marine region (PAME 2019). The area is not well covered by OSPAR's monitoring programme. The state of knowledge on marine litter, including microplastics, primarily stems from (anecdotal) information and case studies, and is not comparable to the information on other areas. This information is more prevalent for areas where human activities are concentrated, including the Barents, Norwegian and Bering Seas, or for specific research topics (e.g., seabirds). Few data are available for the central Arctic Ocean and the coastal areas around it in Siberia, Arctic Alaska, mainland Canada and the Canadian Arctic archipelago.
The limited analysis carried out of macrolitter washed ashore on Arctic beaches or accumulating on the seafloor indicates that most can be attributed to fishing activity, for example, nets, floats, and other debris. The “plastic in a bottle” project coordinated by the PAME Secretariat also highlights the long-distance and often transboundary transport of marine plastic waste throughout the Arctic.
Beach litter is abundant in Region I (based on a few datapoints) with a median total abundance of 252 items /100 m on the three Icelandic beaches considered in the assessment. Plastics accounted for up to 97% of the litter observed.
A study of the distribution and abundance of marine litter in the Nordic Seas examined 1 778 video transects, of which 27% contained litter. The density of litter in the Barents Sea and Norwegian Sea was 202 and 279 items/km2, respectively, with the highest densities close to the coast and in canyons. Plastic and fishing-related items were the most common, a similar finding to the OSPAR seafloor litter assessment. Litter levels were comparable to others recorded in Europe (Buhl-Mortensen, 2017)
There is some evidence that marine litter, including microplastics, is transported into the Arctic by ocean surface currents from distant sources. The presence of microplastics in sea ice has also been documented, and the role of sea ice as a pathway for redistributing marine litter, including microplastics, in the Arctic Ocean has been investigated. The flow of sea ice from the inner Arctic towards the Fram Strait and the Greenland Sea, associated with the Transpolar Drift Current, has been proposed as a possible mechanism by which microplastics are transferred towards the marginal ice zone (i.e., the transition between the open ocean and sea ice), where they are released into the water when the sea ice melts.
.")
Figure P.11: Screenshot of the CleanAtlantic Marine Litter Viewer showing the time- and spatial- averaged density of floating macro litter (items > 2,5 cm).
The colour scale indicates the density in each ICES cell where data are available (the darker the colour the higher the density, ranging from zero to 4,60 items km-2). For more detailed information (average densities, time series, histograms, and pie charts with main types of litter recorded) go to: http://www.cleanatlantic.eu/MarineLitterViewer/index.html
CleanAtlantic – floating litter assessment
Floating marine macrolitter is the proportion of marine litter, comprising items larger than 2,5 cm, that floats in the superficial layer of the water column. As the mobile component of marine litter, it can provide indications of the main sources, sinks, and pathways and enable the effectiveness of waste prevention measures to be assessed.
As part of the global assessment of the status of marine litter in the Atlantic area carried out under the CleanAtlantic project (Interreg Atlantic Area Programme), IEO and IFREMER analysed their floating macro litter-data on the OSPAR Maritime Area. These data, obtained by visual observation following common methodologies, were recorded by experienced top-predator observers during fish-stock assessment campaigns carried out from 2007 to 2020 in the north-west Iberian shelf, the Bay of Biscay, the Celtic Seas, the English Channel and the southern part of the North Sea.
The spatial (at ICES cell level) and time-averaged floating macrolitter densities recorded ranged from zero to 4,60 items km-2, plastic being the type of litter more commonly found. The area with the highest density was the Bay of Biscay, especially in the south-east corner where the maximum values were found (maximum average density was 23,6 items km-2 in 2016 off the coast between San Sebastian and Bilbao in Spain). No temporal tendency could be derived from the data. The complete report and online viewer (see screenshot in Figure P.11) are available on the project website (http://www.cleanatlantic.eu/).
These preliminary results will be further assessed to check the effect of any potential confounding factors that might be hindering the detection of spatio-temporal trends (e.g., the different number of surveys available per ICES cell, which ranged between 1 and 491).
Footnotes
2 Median values are in general lower than mean (average) values. In addition, adjusted calculation methods are needed to combine median values (e.g., adding up to totalcount values)
Plastic particles in stomachs of Fulmars:
Van Franeker, J.A., Blaize, C., Danielsen, J., Fairclough, K., Gollan, J., Guse, N., Hansen, P.L. , Heubeck, M., Jensen, J.-K., Le Guillou, G., Olsen, B., Olsen, K.O., Pedersen, J., Stienen, E.W.M., Turner, D.M., 2011. Monitoring plastic ingestion by the northern fulmar Fulmarus glacialis in the North Sea. Environmental Pollution 159: 2609-2615 https://doi.org/10.1016/j.envpol.2011.06.008
Van Franeker, J.A., Law, K.L., 2015. Seabirds, gyres and global trends in plastic pollution. Environmental Pollution 203: 89-96 http://dx.doi.org/10.1016/j.envpol.2015.02.034
Van Franeker, J.A., Kühn, S., Anker-Nilssen, T., Edwards, E.W.J., Gallien, F., Guse, N., Kakkonen, J.E., Mallory, M.L., Miles, W., Olsen, K.O., Pedersen, J., Provencher, J., Roos, M., Stienen, E., Turner, D.M., van Loon, W.M.G.M., 2021. New tools to evaluate plastic ingestion by northern fulmars applied to North Sea monitoring data 2002–2018. Marine Pollution Bulletin 166: 112246 doi https://doi.org/10.1016/j.marpolbul.2021.112246
Ingestion of plastic particles in turtles:
INDICIT Consortium (2021) Implementation of the Indicator of marine litter on Sea turtles and biota in Regional Sea Conventions and Marine Strategy Framework Directive (MSFD) areas, 82 pages. https://indicit-europa.eu/cms/wp-content/uploads/2019/09/INDICIT-Final-report_Final.pdf
Microplastics:
GESAMP. 2021. Sea-based sources of marine litter., (Gilardi, K., ed.) (IMO/FAO/UNESCO-IOC/UNIDO/WMO/IAEA/UN/UNEP/UNDP/ISA Joint Group of Experts on the Scientific Aspects of MArine Environmental Protection). Rep. Stud. GESAMP No. 108, 109p.
Gilardi, K. V. K., Antonelis, K., Galgani, F., Grilly, E., He, P., Linden, O., Piermarini, R., et al. 2020. Sea-based Sources of Marine Litter–A Review of Current Knowledge and Assessment of Data Gaps. Second Interim Report of GESAMP Working Group, 43.
Kvale, K., Prowe, A. E. F., Chien, C.-T., Landolfi, A., and Oschlies, A. 2021. Zooplankton grazing of microplastic can accelerate global loss of ocean oxygen. Nature communications, 12: 1–8. Nature Publishing Group.
Meijer, L. J., van Emmerik, T., van der Ent, R., Schmidt, C., & Lebreton, L. (2021). More than 1000 rivers account for 80% of global riverine plastic emissions into the ocean. Science Advances, 7(18), eaaz5803.
OSPAR. 2017. Assessment document of land-based inputs of microplastics in the marine environment.
Marine litter in the Arctic:
Buhl-Mortensen, L., (2017) - Marine litter in the Nordic Seas: distribution, composition and abundance. Marine Pollution Bulletin, http://dx.doi.org/10.1016/j.marpolbul.2017.08.048
PAME (2019) - Desktop study on marine litter including microplastics in the Arctic
Technical supplement 1 - Synthesis of data on riverine macrolitter in OSPAR region II
| Activities | State |