

Executive summary
Nutrients, especially nitrogen and phosphorus, are essential for the growth of the aquatic plants that form the basis of marine food webs. Natural processes regulate the balance between nutrient availability and the growth of marine plants and animals in ecosystems. Excess nutrients introduced into the sea by human activities can disturb this balance, resulting in accelerated algal growth. This leads to adverse effects on water quality and marine ecology such as algal blooms, increased turbidity and eventually hypoxia, potentially causing fish and shellfish mortality (Figure 1). This process is known as eutrophication. Eutrophication harms water quality regulation and acts as a stressor on other ecosystem components. OSPAR works under its North-East Atlantic Environment Strategy (NEAES) 2030 to tackle eutrophication and to achieve a healthy marine environment.
This report describes the fourth application of the OSPAR Common Procedure for the assessment of eutrophication, which was conducted for the period 2015-2020. It identifies areas with eutrophication problems and where remediation measures are needed. Eutrophic areas were identified along the continental coasts from France to Denmark/Sweden and in river plumes of the Greater North Sea and the Bay of Biscay. Reanalysis of the previous three assessments shows a gradual improvement since 2000. However, the OSPAR 2010 objective “to combat eutrophication, with the ultimate aim of achieving and maintaining a healthy marine environment where anthropogenic eutrophication does not occur” has not yet been fully achieved.

Figure 1: Schematic illustration of issues associated with eutrophication
During the industrial revolution, growing urbanisation in the OSPAR region, growing human populations and natural resource use, together with inadequately developed wastewater management, resulted in excess nutrients entering rivers and the sea. This caused historical eutrophication, particularly in shallower seas and coastal waters. Throughout the 20th century, while urban sewage management improved, the post-war need for food security and economic growth resulted in agricultural intensification and the use of vast amounts of mineral fertilizer to support this growth in output. The resulting nutrient discharges to waterways and estuaries led to large-scale marine eutrophication, particularly in the North Sea. In recent decades overall nutrient inputs have decreased. Fertilizer use has fallen significantly but nonetheless, agriculture remains a major nutrient source in our rivers and seas. Although industrial, agricultural, and domestic emissions of nitrogen into the air have also decreased substantially since 1990s, these sources still make up a third of the nitrogen reaching the sea. Future work to combat eutrophication in the OSPAR Maritime Area needs to further address these nutrient sources.
This application of the OSPAR Common Procedure differs from previous assessments, in that ecologically coherent assessment units and assessment thresholds have now been developed which reflect characteristics of the ecosystem rather than national boundaries. In addition, remote sensing and in situ data have been combined in an automated assessment tool, ensuring a genuinely “regionally harmonised” assessment.
Q1. Identify the problems? Are they the same in all OSPAR Regions?

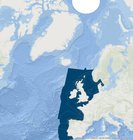
Figure 2: Location of the five OSPAR Regions comprising the OSPAR Maritime Area
OSPAR’s overall strategic objective regarding eutrophication is to “tackle eutrophication, through limiting inputs of nutrients and organic matter to levels that do not give rise to adverse effects on the marine environment”. To determine progress towards this objective, the OSPAR Common Procedure was revised and was applied for the fourth time in 2022 in OSPAR Regions II, III and IV (Figure 2), using data from 2015 to 2020. For the first time, the Common Procedure was based on ecologically relevant assessment areas and harmonised assessment thresholds, enabling a regionally coherent assessment outcome. Assessment areas have been defined by oceanographic criteria rather than international boundaries, so that assessments are now consistent across international boundaries, by contrast with previous practice. The use of OSPAR's Common Procedure Eutrophication Assessment Tool (COMPEAT) coupled with the refining of specific small-scale assessment areas (sub-area scale), has led to objective measures of eutrophication status which have a common scientific basis across the whole of the OSPAR Maritime Area. In addition, the thresholds for assessing status come primarily from an ensemble modelling approach or have been reported by the Contracting Parties for the assessment areas in which the modelling could not be applied, which provides a more objective measure for each assessment area than in previous assessments.
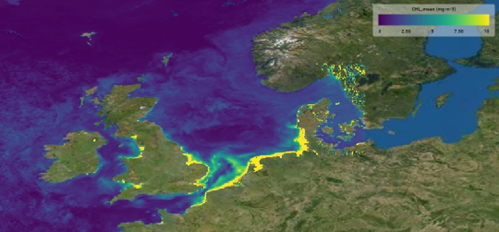
The fourth application of the COMP indicates that eutrophication problem areas persist in particular along the continental coasts from France to Denmark/Sweden and in Regions II and IV. Mainly river plumes and coastal areas of Regions II and IV were affected by eutrophication, indicating that riverine nutrient inputs remain the major source.
Among the river plumes, 58% (15 555 km2) did not achieve non-problem area status, while 22% (44 861 km2) of the coastal areas and 10% (92 488 km2) of the shelf areas did not achieve this status. The areas that are still eutrophic are Coastal French Channel, Scheldt plume, Meuse plume, Rhine plume, Ems plume, Elbe plume, German Bight Central, Outer coastal DEDK, Eastern North Sea, Kattegat Coastal and Kattegat Deep in Region II as well as Adour plume, Gironde plume, Gulf of Biscay coastal and Gulf of Biscay shelf in Region IV. By contrast, oceanic areas were not affected by eutrophication. Coastal waters subject to the EU Water Framework Directive were not assessed by OSPAR. Altogether, approximately 6% (152 904 km2) of the OSPAR Maritime Area is eutrophic.
Since the QSR in 2010, the eutrophication status of the OSPAR Maritime Area has slightly improved. A change in status from problem to non-problem areas has been observed mainly offshore in the southern part of the North Sea (away from the coastal plumes), Belgian offshore waters, the former Dutch Southern Bight area and, partly, in Dutch coastal waters. These areas are now combined in the new transboundary area of Southern North Sea. A direct comparison of status assessment results in the different areas is difficult owing to change in the subdivision of assessment areas between QSR 2010 and QSR 2023. Several parts of the South-eastern North Sea and Kattegat remain classified as problem areas.
The main eutrophication effect that leads to classification as a problem area is elevated chlorophyll-a concentrations as a proxy for phytoplankton biomass. While winter concentrations of dissolved inorganic nitrogen (DIN) and phosphorus (DIP) have continued to decrease, mainly in coastal and some shelf areas of OSPAR Regions II, III and IV, this decrease has not resulted in a comparable decline in chlorophyll-a concentrations. The reason is that the phytoplankton biomass is controlled not only by nutrients but by a complex interplay of different processes including light limitation and grazing. However, chlorophyll-a concentrations show significant decreasing trends in the Coastal French Channel, Coastal DEDK, German Bight, Kattegat Coastal and Kattegat Deep. Nevertheless, there are also some non-problem areas that show significantly increasing concentrations. These are the Loire plume, the Liverpool Bay plume, and Gulf of Biscay coastal waters and shelf waters.
The second effect indicator assessed for all areas was dissolved oxygen concentrations near the seafloor. Oxygen depletion (concentrations <6 mg/l) was observed in seven assessment areas: Adour plume, Gironde plume, Gulf of Biscay coastal, Gulf of Biscay shelf waters, the Eastern North Sea, Kattegat Coastal and Kattegat Deep. The Atlantic region, Norwegian Trench, Scheldt plume, Meuse plume and Northern North Sea showed statistically significant decreasing trends and a deterioration of the oxygen situation. Concentrations in Kattegat Coastal and Kattegat Deep, while lower than 6 mg/l, have increased.
Considering the causative factors of eutrophication, namely the winter nutrient concentrations, DIN thresholds were more often exceeded (in 12 assessment areas) than DIP thresholds (in four assessment areas), indicating that stronger reductions of nitrogen inputs are necessary in the future.
The fourth application of the Common Procedure was conducted using the fully automated COMPEAT tool. As well as providing an assessment of eutrophication status and its confidence level, the tool enabled a retrospective assessment to be made through the re-running of COMP1 (1990-2000), COMP2 (2001-2006) and COMP3 (2006-2014), thereby delineating the history of eutrophication from 1990 until today in Regions II, III and IV. The use of COMPEAT coupled with the refining of specific small-scale assessment areas (sub-area scale) has led to an objective status assessment which has a common scientific basis across the whole of the region. Assessment areas have been defined by oceanographic criteria rather than international boundaries, and assessments are now therefore consistent across international boundaries, by contrast with previous practice.
Q2. What has been done?
Nutrient input reductions
The OSPAR Contracting Parties have made significant efforts to reduce nutrient losses to the marine environment. As early as 1988, the Contracting Parties agreed to reduce nutrient emissions to the Greater North Sea by 50% (PARCOM 88/2). This commitment was reinforced by PARCOM 89/4, which introduced a coordinated programme to reduce nutrient inputs. PARCOM 92/7 introduced a range of measures which targeted agricultural practices that were causing excessive nutrient losses. These measures to reduce inputs have since been implemented, and in several cases augmented, by European Union directives covering wastewater treatment, nitrates in agriculture, industrial emissions and water and marine management. Furthermore, atmospheric emissions are regulated through the Gothenburg Protocol of the United Nations Economic Commission for Europe (UNECE) Convention on Long-range Transboundary Air Pollution (CLRTAP), which is implemented by EU Member States through the National Emissions Ceilings Directive (2016/2284/EU).
As a result of these regulations and agreements, wastewater treatment and industrial point sources have reduced their discharges of both nitrogen and phosphorus. Riverine inputs of phosphorus have decreased significantly, as have atmospheric nitrogen inputs. Waterborne nitrogen inputs have not decreased as much. Waterborne inputs to the Arctic have increased substantially since the 1990s owing to a growing aquaculture industry. However, since this area has had no history of eutrophication, no assessment has been made this time.

Aerial view of purification tanks at a wastewater treatment plant. © Shutterstock
The most dramatic improvements have come in the form of atmospheric nitrogen input reductions and a reduction in fertilizer use, since 1990. Atmospheric nitrogen disperses far away from coasts, deposits directly onto productive surface waters and is completely bio-available. It accounts for approximately a third to a half of the nitrogen input to Regions II – IV. In Region I the atmospheric component is approximately 75% of the total nitrogen input. It has been reduced as a result of applying and reviewing the CLRTAP Gothenburg Protocol and incorporating those targets into legally binding EU directives. The transition to less combustion for power generation, transport, heating and cooking has not only improved air quality in towns but also enabled emissions targets to be met and inputs to the sea to be reduced.
Phosphorus fertilizer use is approximately a quarter of what it was in 1990 and nitrogen use has been reduced by approximately a third. The timing of the greatest reduction appears coincident with the introduction of the EU Nitrates Directive, but also with OSPAR’s measures to tackle nutrient losses from agriculture. Over this period, while fertilizer use has decreased slowly, dairy and meat production continues to increase, creating growing demand for fodder crops and increasing the production of manure and urine. Increased protein consumption in society also leads to increased nitrogen excretion, and the management of manure, urine and human excreta remain significant challenges to the efforts to prevent eutrophication.
Q3. Did it work?
The four applications of the Common Procedure have revealed a steadily improving trend in the eutrophication status of OSPAR Regions II, III and IV. The first assessment covering the period 1990 – 2000 was characterised by poor conditions in much of the North Sea and bad conditions in the south-east and Kattegat. Later assessments show a contraction of eutrophication extending back towards the continental coasts. Eutrophication persists in the river plumes and in some coastal areas. The latest assessment shows areas of moderate status outside the Loire and Seine estuaries, along the Dutch and German coasts, the Eastern North Sea and in the deep Kattegat. Poor conditions occur in the coastal Kattegat and Elbe plume areas, and no areas are considered bad.
Q4. How does this field affect the overall quality status?
Interaction with other assessment themes (e. g. biodiversity, pelagic habitats)
The biodiversity outcomes show that the decreases in nutrient concentrations, particularly for phosphates entering the North Sea, may be driving downward trends in phytoplankton biomass across the Greater North Sea. Despite the efforts to reduce nutrient concentrations, the disequilibrium between nitrates and phosphates has increased, leading to an imbalance of nutrients. This imbalance has negatively affected phytoplankton biomass and is projected to continue owing to the success of phosphorus reduction compared with less successful nitrogen measures ( Inputs of Nutrients Indicator Assessment ). Nutrient imbalances can lead to a dominance of smaller taxa and potentially impact the plankton community. This situation corresponds with a general global decline in phytoplankton, with a pronounced decline at successively higher trophic levels. Such so-called “trophic amplification” of biomass decline has the potential to magnify the impacts on production from many of the services in pelagic environments, for example on fishery yields.
Future assessments must consider how to include plankton community indicators directly in the eutrophication assessment. The assessment needs to build evidence of how nitrate and phosphate ratios lead to changes in phytoplankton communities which negatively impact the efficiency of the ecosystem services those communities provide. An improved understanding of nearshore plankton dynamics and the influence of river flows can inform the measures required to manage the nitrogen inputs from sources such as urban wastewater and agriculture.

An improved understanding of nearshore plankton dynamics and the influence of river flows can inform the measures required to manage the nitrogen inputs from sources such as urban wastewater and agriculture. © Pixbay
The assessment areas developed for eutrophication and based on phytoplankton seasonal patterns and hydrological criteria were also adopted for the assessments of pelagic habitat and food web indicators, thereby facilitating comparison between these assessments. In addition to identifying areas where eutrophication is a problem, the information gathered also indicates spatial and temporal patterns for the primary producers (notably algae) that form an important basis for marine food webs. In the Greater North Sea (Region II), the “Not good” status of the coastal habitats under the PH2 – Changes in Phytoplankton Biomass and Zooplankton Abundance indicator , and of the shelf habitats under both the PH1/FW5 and PH2 the indicators, as well as the high number of significant trends with likely links to anthropogenic climate change, have resulted in the pelagic habitats being classified as “Not good”. This is a different outcome from the eutrophication assessment in which parts of the Greater North Sea (Region II) achieved good status. This mismatch is likely due to the different datasets underlying these assessments, but also to the lack of plankton community measurements within the eutrophication assessment. Additionally, the biodiversity assessment discusses the impact of climate change and how temperature rises are likely to be impacting benthic-pelagic coupling in coastal and shelf areas, with rising sea surface temperatures linked to upward trends in the abundance of meroplankton and the larvae of benthic organisms, and to downward trends in holoplankton which spend their entire lifecycle as plankton.
Another important comparison is with the pilot assessment of primary productivity (FW2) which is strongly related to phytoplankton biomass and therefore chlorophyll-a. This assessment concluded that over the long term (1997-2019), primary productivity was stable in Regions II, III and IV. Significant decreases occurred in the majority of assessment areas, except for the Kattegat area, in 2015-2019, likely driven by de-eutrophication and climate change, which may disturb higher trophic levels. Since only long-term trend analyses were performed for the eutrophication indicator chlorophyll-a, a direct comparison is not straightforward, but the use of primary productivity should be considered as additional evidence in future assessments.
The assessment on Changes in Phytoplankton and Zooplankton Communities (PH1/FW5) looked into changes in functional groups in the current assessment period (2015 and 2019) compared with previous years. Changes in the abundance of diatoms and/or dinoflagellates were estimated to be driven by changes in nutrients in several coastal waters in the eastern part of the North Sea, the Channel, around the United Kingdom and Ireland and also in the area named Atlantic Seasonally Stratified. Nutrient imbalances are occurring in many coastal waters as a result of successful phosphorus management and less successful mitigation of direct and diffuse nitrogen. Nutrient imbalances and their impact on coastal plankton communities should be considered a key component of future assessments. The assessment on Changes in Biodiversity Index (PH3) also compared the current assessment period against previous years, focusing on diversity indices for phytoplankton and zooplankton. Significant changes in phytoplankton diversity were observed in only a small number of areas in the Celtic Seas and the North Sea. Nutrients were considered to be drivers of change mainly in coastal areas of the United Kingdom and Ireland, but also the Atlantic Seasonally Stratified area and along the Spanish and Portuguese coasts, and to a lesser extent in the eastern part of the North Sea.
Further harmonisation of data sources and assessment methods between the eutrophication and pelagic and food web assessments is expected to increase comparability. Moreover, further analyses of the relationships between these assessments will help improve understanding of how nutrient loads affect ecosystem functioning and at which nutrient concentrations the ecosystem can be considered healthy.
The Intergovernmental Panel on Climate Change (IPCC), through its Special Report on the Ocean and Cryosphere in a Changing Climate (SROCC) and subsequently its Sixth Assessment Report on Climate Change 2021, concluded that there is a growing consensus that between 1970 and 2010 the open ocean very probably lost 0,5-3,3% of its dissolved oxygen in the upper 1 000 m, and that oxygen minimum zones are expanding. In coastal ocean regions, anthropogenic eutrophication via continental run-off and atmospheric nutrient deposition, and ocean warming, are very likely to be the main drivers of deoxygenation. Future work should aim to decouple, where possible, the impacts of eutrophication on benthic ecology. Measures to reduce anthropogenic eutrophication need to be prioritised over those to mitigate the impacts of oxygen reductions in high-risk areas.
Q5. What do we do next?
In respect of eutrophication, the indications are that along the continental coast of Regions II and IV, further efforts to reduce nutrient inputs are necessary in order to achieve the strategic objective of the North-East Atlantic Environment Strategy (NEAES) 2030.
In parallel with the work “to determine the maximum inputs of nutrients for relevant assessment areas which prevent deterioration and enable the achievement of non-problem area status throughout the North-East Atlantic”, as foreseen in operational objective S1.O2 of the NEAES, it is important to align the threshold values for the dissolved nutrients and chlorophyll-a with an understanding of how a healthy ecosystem functions, in order to establish an ongoing scientifically sound narrative for deriving threshold values from reference conditions that does not require individual Contracting Parties to adjust those values.
OSPAR’s eutrophication modelling group (ICG-EMO) needs to begin the work of determining maximum nutrient inputs according to objective S1.O2, with this work paving the way for agreement on the nutrient reduction needs that enable each Contracting Party to stay at or below the maximum input levels (objective S1.O3). This work needs to give adequate consideration to transboundary nutrient transports, both between Contracting Parties and from outside the OSPAR Maritime Area. While deriving nutrient reduction needs is scientifically challenging and requires some time, it is important to undertake immediate measures in catchments where nutrient inputs are increasing, or eutrophication effects are deteriorating. This includes selected catchments in OSPAR Regions II and IV, as well as the overall waterborne nutrient inputs in Region I caused by intensive marine aquaculture.
The extent of the growth in aquaculture within the OSPAR Maritime Areas is striking. Region I was alone in showing significant increases in waterborne nutrient inputs. Analysis of the changes in direct discharges to the OSPAR Convention area has shown that almost all the improvements in industrial discharges and wastewater treatment have been cancelled out by the increases from marine aquaculture. Although OSPAR has issued Recommendation PARCOM 94/6 concerned with reducing the input of toxic substances from aquaculture and requiring national reports on best environmental practices and water quality, reporting under the Recommendation was suspended in 2006. Moreover, marine aquaculture is not covered by either the EU Industrial Emissions Directive or its associated BREF documents. A gap therefore exists concerning the agreement of minimum environmental standards for aquaculture across the OSPAR Maritime Area, but also - since the COMP analysis did not cover Arctic waters – there is a knowledge gap as to whether the substantial increase in nutrient inputs is causing eutrophication in OSPAR Arctic waters.
Lastly, climate change leads, among other effects, to floods and droughts which cause stronger variations in nutrient inputs. More investigation is needed in order to understand the ecological effects of this greater variability and how to adequately monitor and assess such increasingly prevalent events for the purposes of future eutrophication assessments.
Eutrophication Assessments

Contributors
Lead authors: Michelle Devlin (UK), Hans Ruiter (NL), Philip Axe (SE), Wera Leujak (DE), Theo Prins (NL) and Birgit Heyden (DE)
Supporting authors: Hermann Lenhart (DE), Lasse Tor Nielsen (DK), Stiig Markager (DK), Francisco J. Gómez Jakobsen (ES), Jesús M. Mercado (ES), David Devreker (FR), Alain Lefevbre (FR), Robert Wilkes (IE), Garvan O’Donnell (IE), Lisette Enserink (NL), Rob Berbee (NL), Rob van der Veeren (NL), Federico Cornacchia (NL), Morten Skogen (NO), Marta Nogueira (PT), Emilie Brevière (SE), Liam Ferdinand (UK), Kate Collingridge (UK), Shannon White (UK), Eileen Bresnan (UK), Adrian Judd (UK), Jemma Lonsdale (UK), Bee Berx (UK), Stephen Dye (UK), Hjalte Parner (ICES), Alejandro Iglesias Campos, Eleanor Dening, Barbara Middleton, Lucy Ritchie, Chris Moulton and Julien Favier.
Supported by: OSPAR Hazardous Substances and Eutrophication Committee (HASEC), Intersessional Correspondence Group on Eutrophication (ICG-Eut), Intersessional Correspondence Group on Eutrophication Modelling (ICG-EMO), OSPAR Technical Group for the Common Procedure (TG-COMP), International Council for the Exploration of the Seas (ICES), Intersessional Correspondence Group on Ecosystem assessment outlook – Cumulative effects (ICG-EcoC), Intersessional Correspondence Group on Economic and Social Analysis (ICG-ESA), Climate Change Expert Group (CCEG).
Citation
OSPAR, 2023. Eutrophication Thematic Assessment. In: OSPAR, 2023: Quality Status Report 2023. OSPAR Commission, London. Available at: https://oap.ospar.org/en/ospar-assessments/quality-status-reports/qsr-2023/thematic-assessments/eutrophication/