

Human activities with the potential to affect eutrophication
The most significant human activity with the potential to affect eutrophication is agriculture. Agricultural activities dominate nutrient discharges to water, while animal husbandry and the use of machinery also lead to significant losses into the air, which can then be deposited directly onto the sea. Wastewater, particularly in large urban centres, has been historically significant. Since the introduction of treatment standards in the 1980s and 1990s the scale of this problem has been reduced. Industrial releases into water have also decreased substantially. In the Arctic Waters (Region I), aquaculture has emerged as the most significant direct input of waterborne nutrients, although in the Region as a whole, nitrogen inputs have decreased owing to the reduction of emissions to the air.
| Arctic Waters | Greater North Sea | Celtic Seas | Bay of Biscay and Iberian Coast | Wider Atlantic | |
|---|---|---|---|---|---|
| Agriculture | |||||
| Intensity | L | H | M | M | L |
| Trend since QSR2010 | ↔ | ↔ | ↔ | ↔ | ↔ |
| Trend to 2030 | ↔ | ↔ | ↔ | ↔ | ↔ |
| Aquaculture | |||||
| Intensity | H | H | M | M | L |
| Trend since QSR2010 | ↑ | ↑ | ↔ | ↑ | ↑ |
| Trend to 2030 | ↑ | ↑ | ↑ | ↑ | ↑ |
Table A.1: Regional summary of main activities leading to eutrophication pressures, including an estimate of past and future trends. While agriculture is expected to remain at a similar level to today, the pressure from agriculture on eutrophication needs to decrease in order to achieve the goal of no anthropogenic eutrophication.
Nutrients enter the OSPAR Maritime Area via waterways and atmospheric deposition. Natural processes such as the weathering of rocks lead to small quantities of nutrients being released, while combustion, such as wildfires, creates oxidised nitrogen compounds which can be deposited on the sea surface. Nutrient leaching from natural soils and soil transport by erosion also introduce nutrients into the marine environment. These natural processes seldom cause eutrophication problems, however. Instead, eutrophication has occurred because of the introduction of large quantities of reactive nitrogen and phosphorus into the marine environment by human activities. The key human activities affecting eutrophication are:
Agriculture (Cultivation of living resources):
Society’s need for food drives the need for agriculture. Agricultural run-off can lead to the input of substances to the environment, including nutrients. Agriculture also contributes significantly to atmospheric emissions of nitrogen. ( Agriculture Feeder Report )
Around 34% of the land in the OSPAR Contracting Parties is given over to agriculture. This extensive land use has a significant impact on biogeochemical cycles. As point sources of nutrients have been mitigated, agriculture has become the most significant activity leading to nutrient losses to the environment. At the cessation of reporting under Recommendation PARCOM 88/2 and 89/4, published in 2008, approximately 84% of reported diffuse nutrient losses came from agriculture or agricultural land, although reporting definitions vary between Contracting Parties, making the exact contribution difficult to assess.
Among anthropogenic sources, agriculture was responsible for more than half of nitrogen losses and about a third of phosphorus losses (Figure A.1). Since 1990, phosphorus inputs from OSPAR Contracting Parties have halved, while waterborne inputs of nitrogen have remained steady. Atmospheric inputs have almost halved, resulting in a roughly 25% reduction in nitrogen inputs to the OSPAR Maritime Area as a whole. ( Inputs of Nutrients Indicator Assessment )

Figure A.1: Contribution by different anthropogenic sources to total losses and discharges of nutrients in 2005, from OSPAR 2008.
Historically, land was drained to increase the availability of high-quality agricultural fields. To keep these areas from returning to marshland, extensive drainage systems were constructed. The resulting arable areas, while highly productive, frequently had poor water and nutrient retention, increasing the risk of nutrient losses. These areas also emit large amounts of CO2 and should therefore be turned into wetlands in order to achieve the goals in the Paris Agreement. In other areas, surface water run-off and resulting soil erosion is problematic, resulting in the loss of particle-bound nutrients. Ploughing and the production of a homogenous surface soil layer have been associated with surface run-off, as has the soil compaction associated with some crop types and the use of heavy machinery.
A range of measures has been developed to mitigate these losses. They include: restrictions on the amounts and timing of nutrient fertilization including balanced fertilization plans; winter plant coverage and riparian buffer strips to reduce surface run-off to streams and rivers; techniques such as cross-slope (rather than down-slope) ploughing to reduce run-off in furrows; no- or minimal-till approaches to reduce soil compaction and disturbance to top layers; removal of land from production – including land swaps – to increase the distance between agricultural land and waterways, and the reestablishment of wetland/wet meadows to obtain natural nutrient removal/retention processes.
Animal husbandry is also a significant source of nutrient losses (Figure A.2). Manure and urea lead to significant emissions to both air and water. Manure has long been used as a fertilizer but increasing awareness of eutrophication problems has led to restrictions on spreading (volumes, timing and techniques) and the requirement for adequate manure storage capacity at farms for when spreading is not permitted. In OSPAR Contracting Parties, animal husbandry for both dairy and meat production has increased steadily since 2007. Production increases do not have to cause a rise in eutrophication pressures in themselves if the atmospheric emissions are trapped and the manure is managed well; however, the increase in dairy and meat production is likely matched by an increase in demand for animal feed, which places more pressure on arable production.
Source: https://projects.luke.fi/ruokafakta/en/milk-and-eggs/milk-production-volumes/
Source: https://projects.luke.fi/ruokafakta/en/meat-and-fish/meat-production-volumes/ and https://www.ssb.no/en/statbank/table/03551/tableViewLayout1/
Figure A.2: Time series of dairy and meat production in OSPAR Contracting Parties (tonnes x 1 000). Data from the Natural Resources Institute, Finland and Statistics Norway. The United Kingdom did not submit data for 2020.
Arable crop production in the OSPAR Contracting Parties has long been dependent on the availability of mineral fertilizers to ensure and improve yields of both food and fodder crops. Figure A.3, produced by the European Fertilizers Manufacturing Association (now Fertilizers Europe), records the rapid increase in European fertilizer use after 1945, reaching a plateau for phosphorus at the end of the 1970s and a peak for nitrogen fertilizer use at the end of the 1980s.
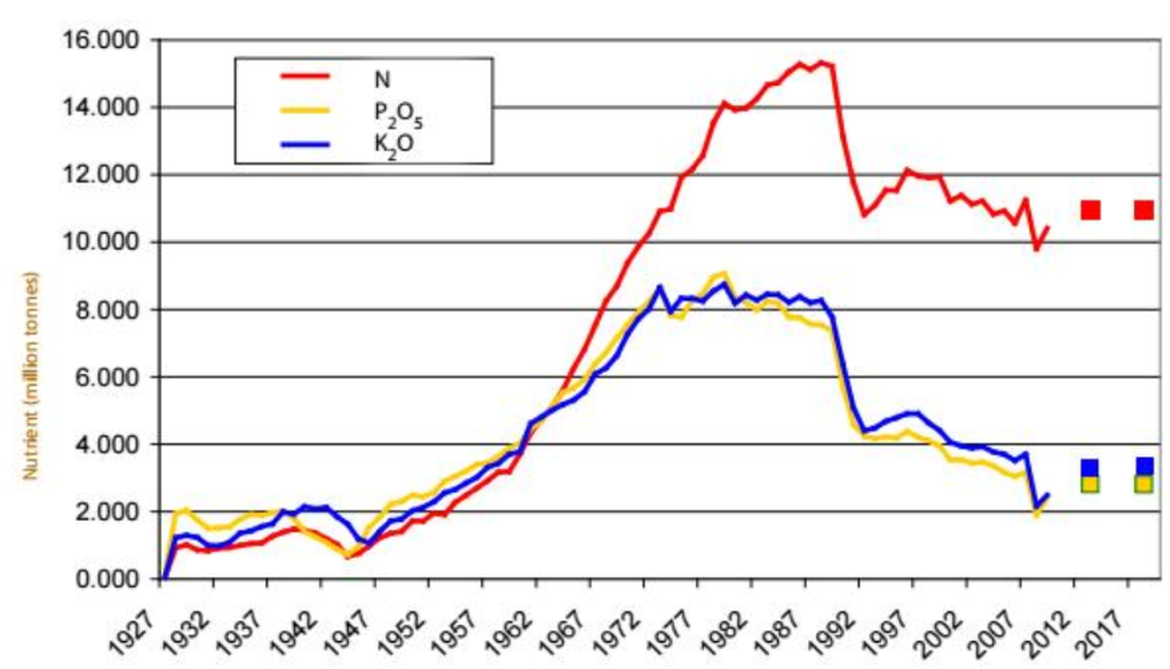
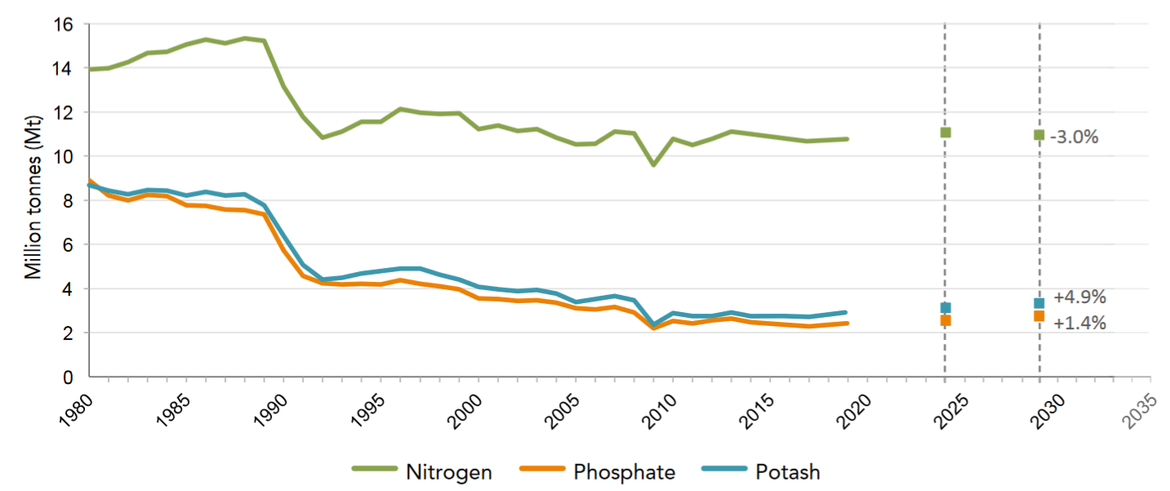
Figure A.3: Historical and predicted fertilizer use in the EU27, from EFMA 2009 (left) and Fertilizers Europe, 2019 (right)
The rapid reduction in fertilizer use at the start of the 1990s coincided with the onset of binding environmental legislation under European directives, but also with an economic downturn (Figure A.4). A similar drop in fertilizer use is apparent in 2009, coinciding with the impact of the 2008 financial crash. Based on data reported to Eurostat, the OSPAR Contracting Parties appear to account for just over half of total EU nitrogen fertilizer consumption – about 7 million tonnes of nitrogen - and about a third of phosphorus fertilizer consumption – about 800 000 tonnes against an EU27 total of 2,4 million tonnes. As for the EU27, OSPAR fertilizer consumption appears stable between 2010 and 2020.
Source: https://ec.europa.eu/eurostat/databrowser/view/AEI_FM_USEFERT__custom_2754449/default/table
Source: https://ec.europa.eu/eurostat/databrowser/view/AEI_FM_USEFERT__custom_2754449/default/table
Figure A.4: Fertilizer use in OSPAR Contracting Parties 2010 - 2020
The EU Nitrates Directive introduced the concept of nitrate vulnerable zones and codes of good agricultural practice, affecting both arable and meat/dairy producers. Under OSPAR Recommendation 92/7, the Contracting Parties agreed to reduce the nutrient load from agriculture through a range of different measures. The EU Common Agricultural Policy and other national schemes include support for environmental measures to reduce agricultural emissions.
Codes of good agricultural practice typically limit animal numbers based on the availability of land, so as to spread the manure generated. Several EU Member States and OSPAR Contracting Parties have implemented exceptions to these levels however, leading to even greater amounts of manure being produced. Increasing specialisation in agriculture has led to the separation of arable land from animal production, resulting in manure being produced in areas where it cannot be used as fertilizer. Precision fertilization techniques have also reduced the attractiveness of manure as a fertilizer compared to mineral sources that can be applied exactly with a known nutrient content. This results in a mismatch between where manure is generated and where it can be used as fertilizer. High transport costs have been a barrier to the re-use of manure as fertilizer although market volatility associated with phosphorus rock extraction and natural gas supply (used in nitrogen fertilizer production) should stimulate further development to address this problem.
Atmospheric ammonium emissions come overwhelmingly (> 90%) from agriculture. Ammonia is a component of dissolved inorganic nitrogen that is considered to be immediately available to marine phytoplankton. Ammonia releases depend on diet, on how animals are kept (free-range, in barns or a mix), how manure and urea are managed around the animals and how these are stored prior to spreading. Even techniques such as cast-spreading in place of soil injection and immediate ploughing-in can result in significant losses to the atmosphere. Atmospheric ammonium typically does not travel great distances but instead is deposited relatively close to the source (Figure A.5). OSPAR waters, particularly in the Eastern North Sea, Celtic Seas and eastern Bay of Biscay, are recipients of significant amounts of atmospheric ammonium, and while oxidised nitrogen emissions and the resulting deposition have reduced significantly since 1995, ammonium deposition to the respective OSPAR Regions has decreased at only about one-seventh of that rate (Figure A.6 and Figure A.7).
 originating in EU member states (Klein et al., 2022)")
Figure A.5. Deposition of reduced nitrogen (ammonium) originating in EU member states (Klein et al., 2022)
Unit: kilotonne per year
Figure A.6: Time series of oxidised (blue) and reduced (orange) nitrogen deposition to all OSPAR Regions, showing small reductions in reduced nitrogen (ammonium) deposition compared with oxidised nitrogen (Gauss et al., 2020).
Figure A.7: NOx (top) and NH4 (ammonium; bottom) emissions to the air from OSPAR Contracting Parties and international shipping in the Atlantic and the North Sea, arranged by industrial sector. NOx emissions show a strong downward trend and in recent years have been lower than ammonium emissions. Data collated from Gauss and Klein, 2022. Ninety per cent of the reduced nitrogen is emitted by agriculture.
Forestry satisfies society’s need for materials as well as being a process that mitigates climate change. Nutrient leakage from forested areas is generally considered to be a natural process although in some commercial plantations artificial fertilizers are used to increase growth rates, while large-scale felling, particularly near water courses, leads to nutrient losses (Copernicus, 2018).
Transport – shipping:
Society’s need for trade and movement of goods and for national security are drivers of shipping activity. The combustion processes associated with shipping emit nitrogen to the atmosphere and, more recently, directly to the marine environment through open- and hybrid scrubber systems. Shipping emissions to the atmosphere from the Atlantic and the North Sea changed only marginally between 1990 and 2019 but are expected to decline with the implementation of the Nitrogen Emission Control Area (NECA) in the North Sea. This differs from the global shipping dataset published in Fagerli et al., 2022, which suggests a roughly 20% decrease between 2000 and 2019.
Transport – land:
Society’s need for trade and movement of goods are drivers of land transport activity. Combustion processes associated with transport emit nitrogen to the atmosphere. Road transport was the largest emitter of oxidised nitrogen to the atmosphere in OSPAR Contracting Parties in 1990. Emissions are still significant – second only to shipping – but are less than a third of the losses recorded in 1990.
Wastewater treatment and disposal:
Society’s need for health and wellbeing and for industrial processes are drivers of waste treatment and disposal. Direct discharges can lead to the input of substances to the environment, including nutrients.
Wastewater treatment plants discharging directly into the OSPAR Maritime Area were responsible for about 10% of the total waterborne nitrogen input and 16% of the total waterborne phosphorus input. Nutrient inputs through direct discharges are reported annually to OSPAR as part of the Riverine Inputs and Direct Discharges component of the Joint Assessment and Monitoring Programme. Between 1990 and about 2005, the amount of nitrogen discharged increased, but since then the inputs have decreased to less than half of the 2005 value (Figure A.8). Total phosphorus inputs from wastewater treatment plants (WWTPs) have decreased more steadily and are now less than half of the 1990 level.
Industrial uses:
Society’s need for trade and movement of goods, stable economies, industrial processes, materials, and health and wellbeing, are drivers of industrial uses. Industrial atmospheric emissions and direct discharges can lead to the input of substances to the environment, including nutrients.
The reduction of nitrogen and phosphorus discharges from industry has been more successful than that from wastewater treatment. Nearly half of direct nitrogen inputs in 1990 were from industry – approximately 60 kt from a total of 150 kt. This may not only reflect better removal but the fact that a lot of industries have been connected to WWTPs and therefore no longer count as direct industrial inputs. The contribution from industrial direct discharges is now some 10 kt. A similar, though less marked decrease has occurred in phosphorus direct discharge, which is approximately half of the 1990 level.
Aquaculture - marine, including infrastructure:
Aquaculture is driven by society’s need for food. This activity can result in the input of substances to the environment, including nutrients. Cultivated non-fed organisms (e.g. filter feeders) may improve water quality.
Reported inputs from aquaculture have increased significantly since OSPAR RID (Riverine and Direct Discharges) reporting started in 1990. Aquaculture is now the primary source of direct nutrient inputs to the OSPAR area, contributing approximately as much nitrogen as industry and wastewater treatment combined. Phosphorus inputs from aquaculture exceed those from all other point sources. As a result of the growth of aquaculture, there was no decrease in total direct discharges of nitrogen to the OSPAR Maritime Area between 1990 and 2019, while phosphorus inputs only decreased by approximately a sixth, despite industrial and wastewater inputs having together decreased by two-thirds since 1990. The inputs from aquaculture are suspected to be an underestimate as not all Contracting Parties have reported aquaculture inputs from all their territories.
The shift in nutrient supply from industrial and wastewaters to aquaculture also involves a geographical shift, as the most significant source is no longer the major coastal/industrial conurbations in Regions II and IV, and the pressure has moved to the Atlantic margins of Regions I and III.
Figure A.8: Nutrient inputs from point sources (direct discharges) into OSPAR Regions I - IV (data from OSPAR RID database). Figure shows total nitrogen (top) and total phosphorus (bottom) inputs.
Climate change (see corresponding thematic assessment and Ocean Acidification ‘other assessment’ ):
Numerous drivers and activities (e.g. burning of fossil fuels, agriculture, deforestation) contribute to climate change, with a number of associated pressures potentially link to eutrophication.
The reader is referred to the thematic assessment on climate change. In brief, climate change is expected to alter land use patterns and agriculture, resulting in changes in nutrient discharges. Episodic events such as flooding are expected to increase suspended sediment and nutrient inputs. Whether this cancels any general decrease in run-off is unclear. Changes in stratification, mixing and temperature will have profound biogeochemical effects and therefore change the sensitivity of the system to eutrophication pressures.
Adaptation to climate change, for example by switching from combustion sources for power generation and transport is producing significant decreases in NOx emissions to the atmosphere, which in turn lead to less atmospheric nitrogen deposition on the sea surface and reduce eutrophication pressures, particularly away from coasts.
Restructuring of seabed morphology, including dredging and depositing of materials [Physical restructuring of rivers, coastline or seabed (water management)]:
Society’s need for trade and movement of goods is a driver for dredging, and disposal and dredging can cause localised increases in nutrients.
Restructuring of the seabed by dredging, depositing or bottom trawling is expected to have a local impact on eutrophication. Traditionally it has been considered that organic material resuspended in disturbed sediment gives increased local oxygen demand. This may become problematic in an already oxygen-stressed environment such as the Kattegat. An additional problem is the destruction of habitat for seaweeds, seagrasses and filter feeders which are long-term stores of nutrients and signs of a healthy environment unaffected by eutrophication.
Aquaculture - freshwater [Cultivation of living resources]:
Aquaculture is driven by society’s need for food. This activity can result in the input of substances to the environment, including nutrients.
In most OSPAR countries, freshwater aquaculture discharges enter the marine environment as part of the diffuse load measured at river mouths, and therefore separate data are not available. Recent developments with land-based recirculating aquaculture systems (RAS) have the potential to significantly reduce nutrient inputs. However, RAS are still in an early stage and have difficulty competing with open cage production, in which wastewaters are discharged untreated.
Copernicus (2018) https://land.copernicus.eu/pan-european/corine-land-cover/clc2018
EFMA, 2009, Forecast of food, farming and fertilizer use in the European Union 2009 – 2019, available online at https://issuu.com/efma2/docs/lo-res-final-forecast2009 accessed 20220916
Fertilizers Europe, 2019, Forecast of food, farming and fertilizer use in the European Union 2019 – 2029, available online at https://www.fertilizerseurope.com/wp-content/uploads/2019/12/Forecast-of-food-farming-and-fertilizer-use-in-the-European-Union.pdf, accessed 20220916
H. Fagerli, A. Benedictow, B. Rolstad Denby, M. Gauss, D. Heinesen, J-E Jonson, K. S. Karlsen, H. Klein, A. Mortier, Á. Nyíri, A. Segers, D. Simpson, S Tsyro, Á. Valdebenito, P. Wind, W Aas, A., Hjellbrekke, S. Solberg, S Platt, K. Tørseth, K. Espen Yttri, B. Matthews, S. Schindlbacher, B. Ullrich, R. Wankmüller,: Z. Klimont,T. Scheuschner, I.A. Gonzalez Fernandez, J..J.P. Kuenen, 2022, Transboundary particulate matter, photo-oxidants, acidifying and eutrophying components, EMEP Status Report 2022; August 25, 2022, ISSN 1504-6192, https://emep.int/publ/reports/2022/EMEP_Status_Report_1_2022.pdf
Klein, H., Gauss, M; Tsyro, S; Nyíri, A; Heinesen, D and Fagerli, H 2022, Transboundary air pollution by sulphur, nitrogen, ozone and particulate matter in 2020: The European Union, https://www.emep.int/publ/reports/2022/Country_Reports/report_EU.pdf
M. Gauss, Nyiri A, and Klein H., 2020, Atmospheric Deposition of Nitrogen to the OSPAR Maritime Area in the period 1995-2018. EMEP MSC-W Report for OSPAR; Meteorological Synthesizing Centre-West (MSC-W) of EMEP, Norwegian Meteorological Institute
OSPAR (2008). Towards the 50% reduction target for nutrients Assessment of Implementation of PARCOM Recommendations 88/2 and 89/4, https://www.ospar.org/documents?v=7122
OSPAR (2022). Agreement 2022-07 on The Common Procedure for the Identification of the Eutrophication Status of the OSPAR Maritime Area. Available at: https://www.ospar.org/documents?v=49366
| Drivers | Pressures |