

Pressures associated with eutrophication
Inputs of nutrients constitute the main pressure with respect to eutrophication. Region I has significantly increasing pressures in coastal waters, although the total nitrogen input pressure across the whole Region is decreasing. Regions II, III and IV show decreasing pressures when considering both atmospheric and waterborne inputs together. Changes in the ratios of nitrogen to phosphorus in the inputs – owing to greater success in reducing phosphorus loads – are likely exerting an additional pressure on species composition.
| OSPAR Region | Arctic Waters (Region I) | Greater North Sea (Region II) | Celtic Seas (Region III) | Bay of Biscay and Iberian Coast (Region IV) | Wider Atlantic (Region V) |
|---|---|---|---|---|---|
Trend (atmospheric and waterborne inputs) | N ↓ | N ↓ | N ↓ | N ↓ | N ↓ |
| Confidence | High | High | High | High | Low |
Confidence is set as “High” in the four Regions where RID data are available. Region V is not assessed owing to a lack of data on waterborne sources. There are data gaps in Regions I – IV but these are not considered to be sufficiently large to change the result of the assessment.
Input of nutrients - diffuse sources, point sources, atmospheric deposition [Substances, litter and energy]:
The input of nutrients from diffuse sources, point sources and atmospheric deposition can lead to nutrient enrichment which in turn can result in deoxygenation and other signs of eutrophication. Even inputs of organic matter can intensify oxygen consumption because of bacterial respiration during decomposition.
Since the start of OSPAR riverine and direct discharge monitoring in 1990 (Figure P.1), the nutrient inputs to the Southern North Sea have been substantially reduced. Greater success in reducing phosphorus inputs may however lead to changes in phytoplankton community structure. Waterborne nutrient inputs to the Arctic have increased 3-5 times since 1990, owing to the increase in aquaculture production.
OSPAR’s Joint Assessment and Monitoring Programme collates data on nutrient inputs from diffuse sources and direct discharges. Contracting Parties report annually the riverine and direct inputs from individual river mouths and discharge outfalls, from coastal sub-regions or basins (aggregated into direct and riverine sources) and at national level (also aggregated). Riverine sources are classified as river mouths – usually at the estuarine limit – or as unmonitored areas. Unmonitored areas are those between monitored river mouths where water and nutrients enter the marine environment via small streams only. Data from these areas are modelled. Direct discharges to the sea are reported. Discharges from upstream of the riverine measurement point are captured through the riverine measurements.
 programme and the respective OSPAR Regions. There are no RID data from the Russian catchment to Region I, or from Region V.")
Figure P.1: Catchments monitored by the OSPAR Riverine and Direct Discharges (RID) programme and the respective OSPAR Regions. There are no RID data from the Russian catchment to Region I, or from Region V.
Atmospheric nitrogen deposition is measured through the OSPAR CAMP network of coastal monitoring sites. However, because of a lack of observations over the sea surface, the analysis of atmospheric nitrogen deposition comes from the EMEP modelling work, which makes use of the CAMP stations that are also included in the EMEP observation network and of emission data reported to the CEIP (Centre on Emission Inventories and Projections). Atmospheric phosphorus deposition is considered to be a natural process uncoupled from eutrophication and is not modelled or monitored.
Analysis of nutrient inputs is summarised in the Inputs of Nutrients Indicator Assessment and Waterborne and Atmospheric Inputs of Nutrients and Metals Other Assessment
Results presented in the factsheet indicate that for Regions I – IV of the OSPAR Maritime Area – those parts of the North-East Atlantic adjacent to the continental landmass including United Kingdom and Irish waters – pressure from nutrient inputs has decreased significantly, both since 1990 but also in the last 10 years (p values < 0,012 for both nitrogen and phosphorus). Closer analysis of the data reveals however that the greatest change in nitrogen inputs is due to reductions in atmospheric nitrogen deposition, which decreased from about 2 000 kt per year in 1990 to less than 1 500 kt in 2019. At the level of the four OSPAR Regions together, there is no significant decrease in waterborne nitrogen inputs.
Waterborne phosphorus inputs to Regions I – IV as a whole have more than halved since 1990 and continue to decrease with a statistically significant trend, albeit at a slower rate than over the 1990 – 2019 period. The marked changes in phosphorus inputs compared to nitrogen are apparent in the effective concentrations from individual rivers presented in Figure P.2.
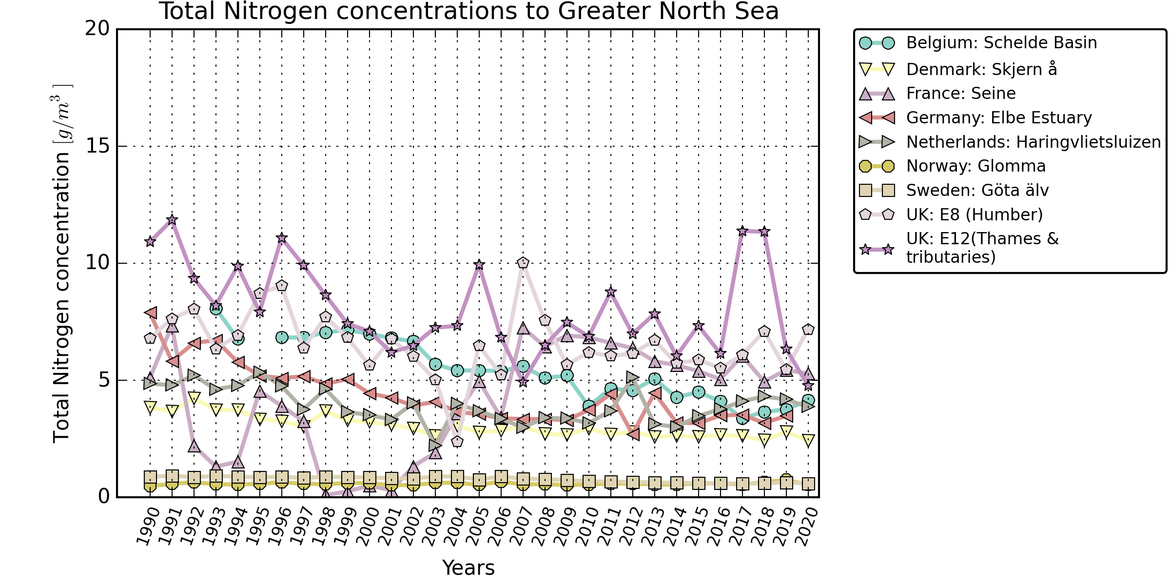
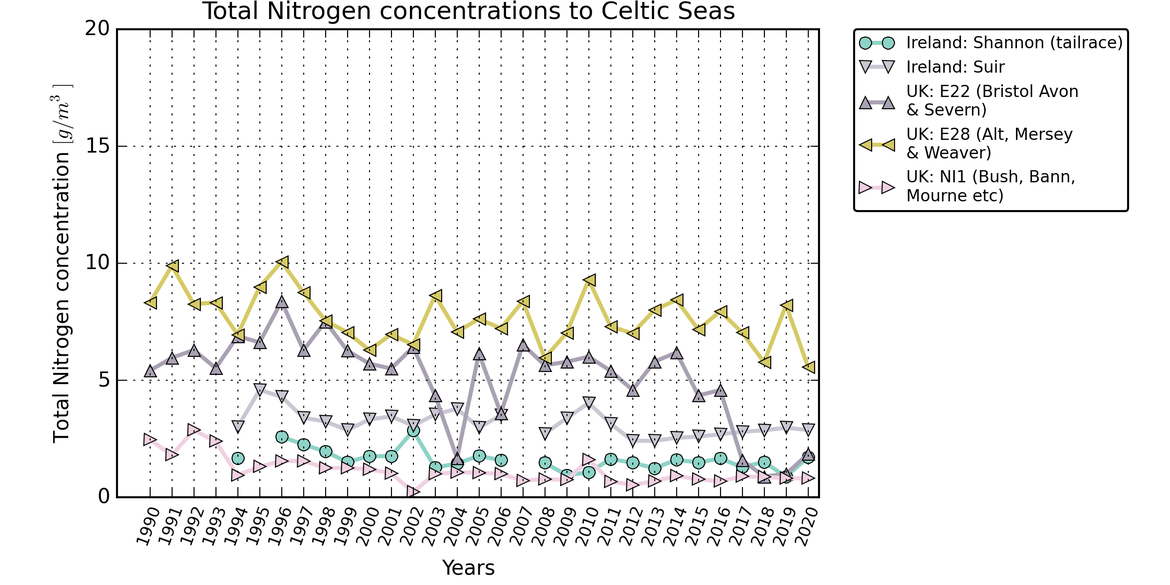
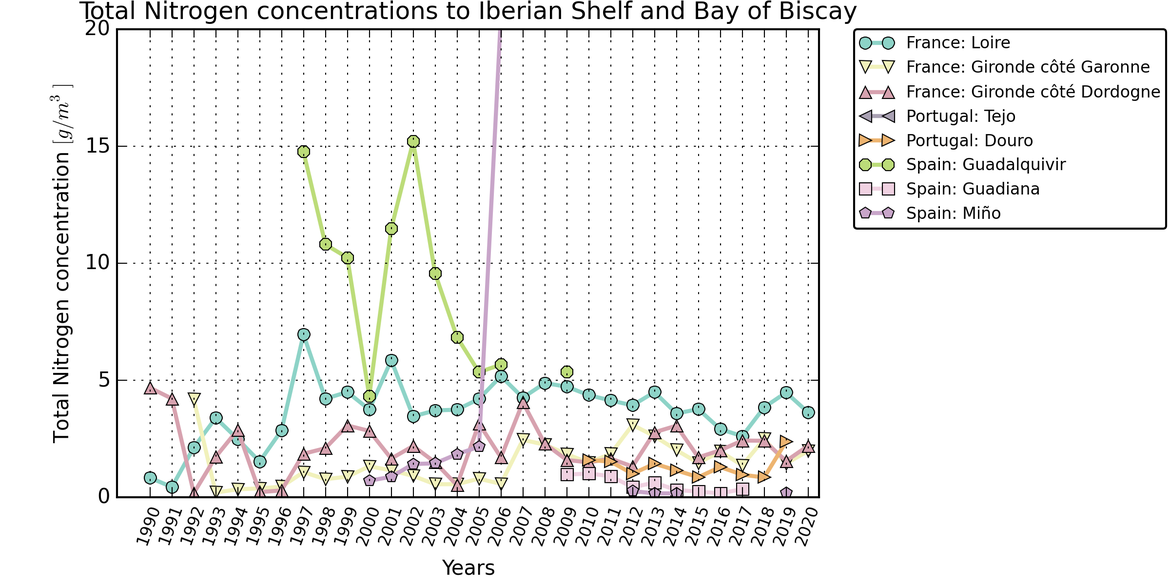
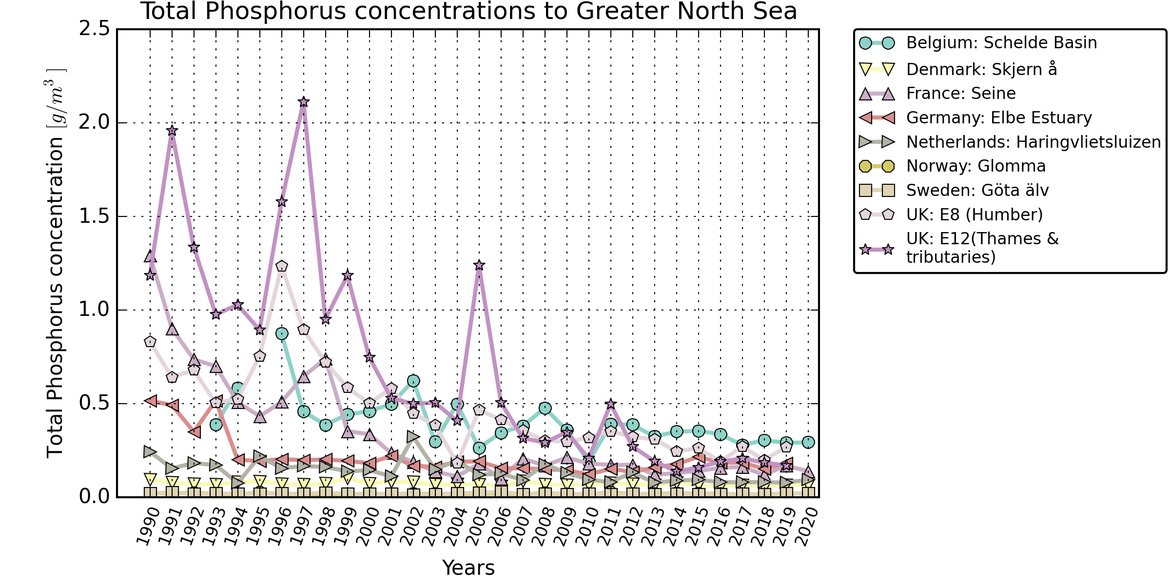
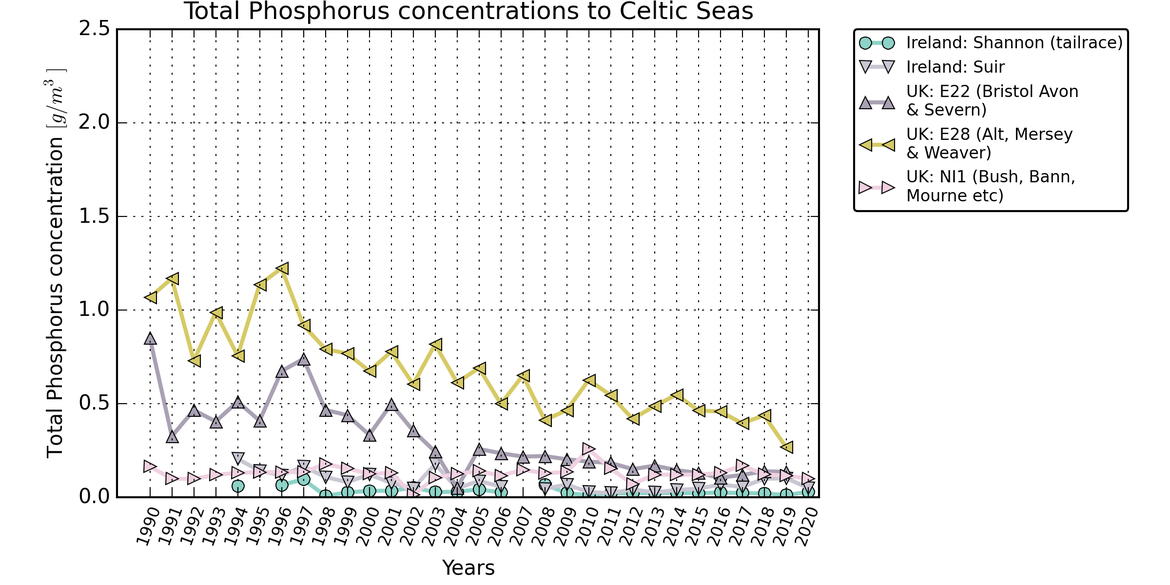
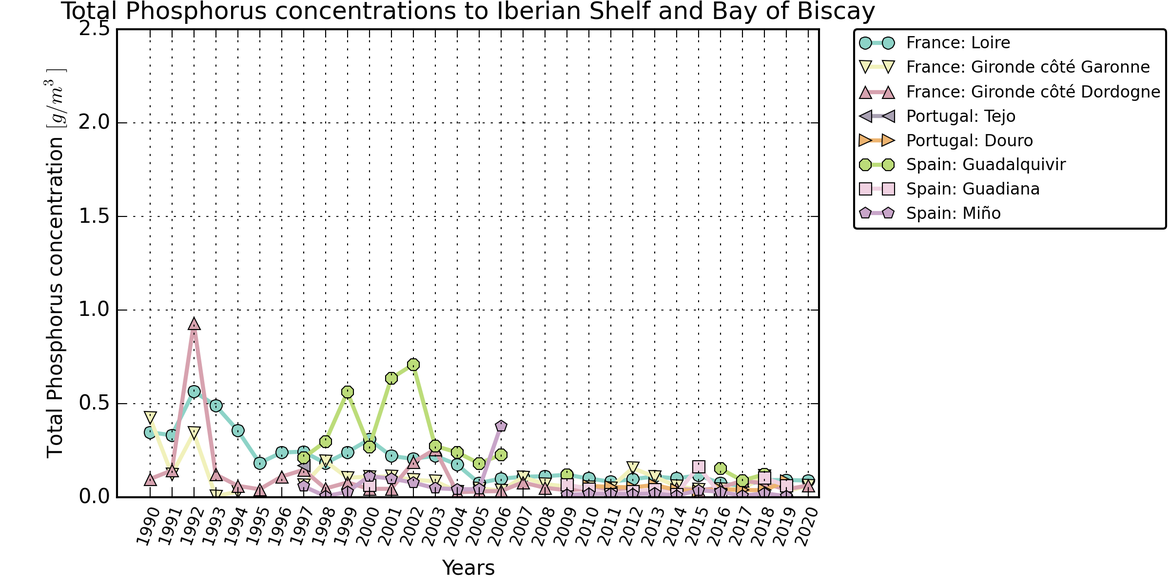
Figure P.2: Effective concentrations (load / flow) for nitrogen (left) and phosphorus (right) for selected rivers draining into OSPAR Regions II (top), III (middle) and IV (bottom)
A similar story emerges when looking at the flow-normalised inputs from selected major catchments and coastal regions (Figure P.3). Waterborne nitrogen inputs have decreased from the United Kingdom, the Rhine, the Elbe and Jutland compared to 1990 – 1999, but increases have occurred via the Loire and the Seine and also in northern Norway. Phosphorus inputs have been reduced substantially however, even from the Loire and the Seine. The only major increases occur along the Norwegian coasts. These changes indicate a shift in the total eutrophication pressure northwards from Regions II and IV towards Region I (Arctic Waters). The greater success in reducing phosphorus compared to nitrogen however – particularly in the eastern Bay of Biscay where nitrogen loads increased while phosphorus loads decreased – can be expected to cause shifts in nitrogen to phosphorus ratios in coastal waters which have been associated with changes in species composition.
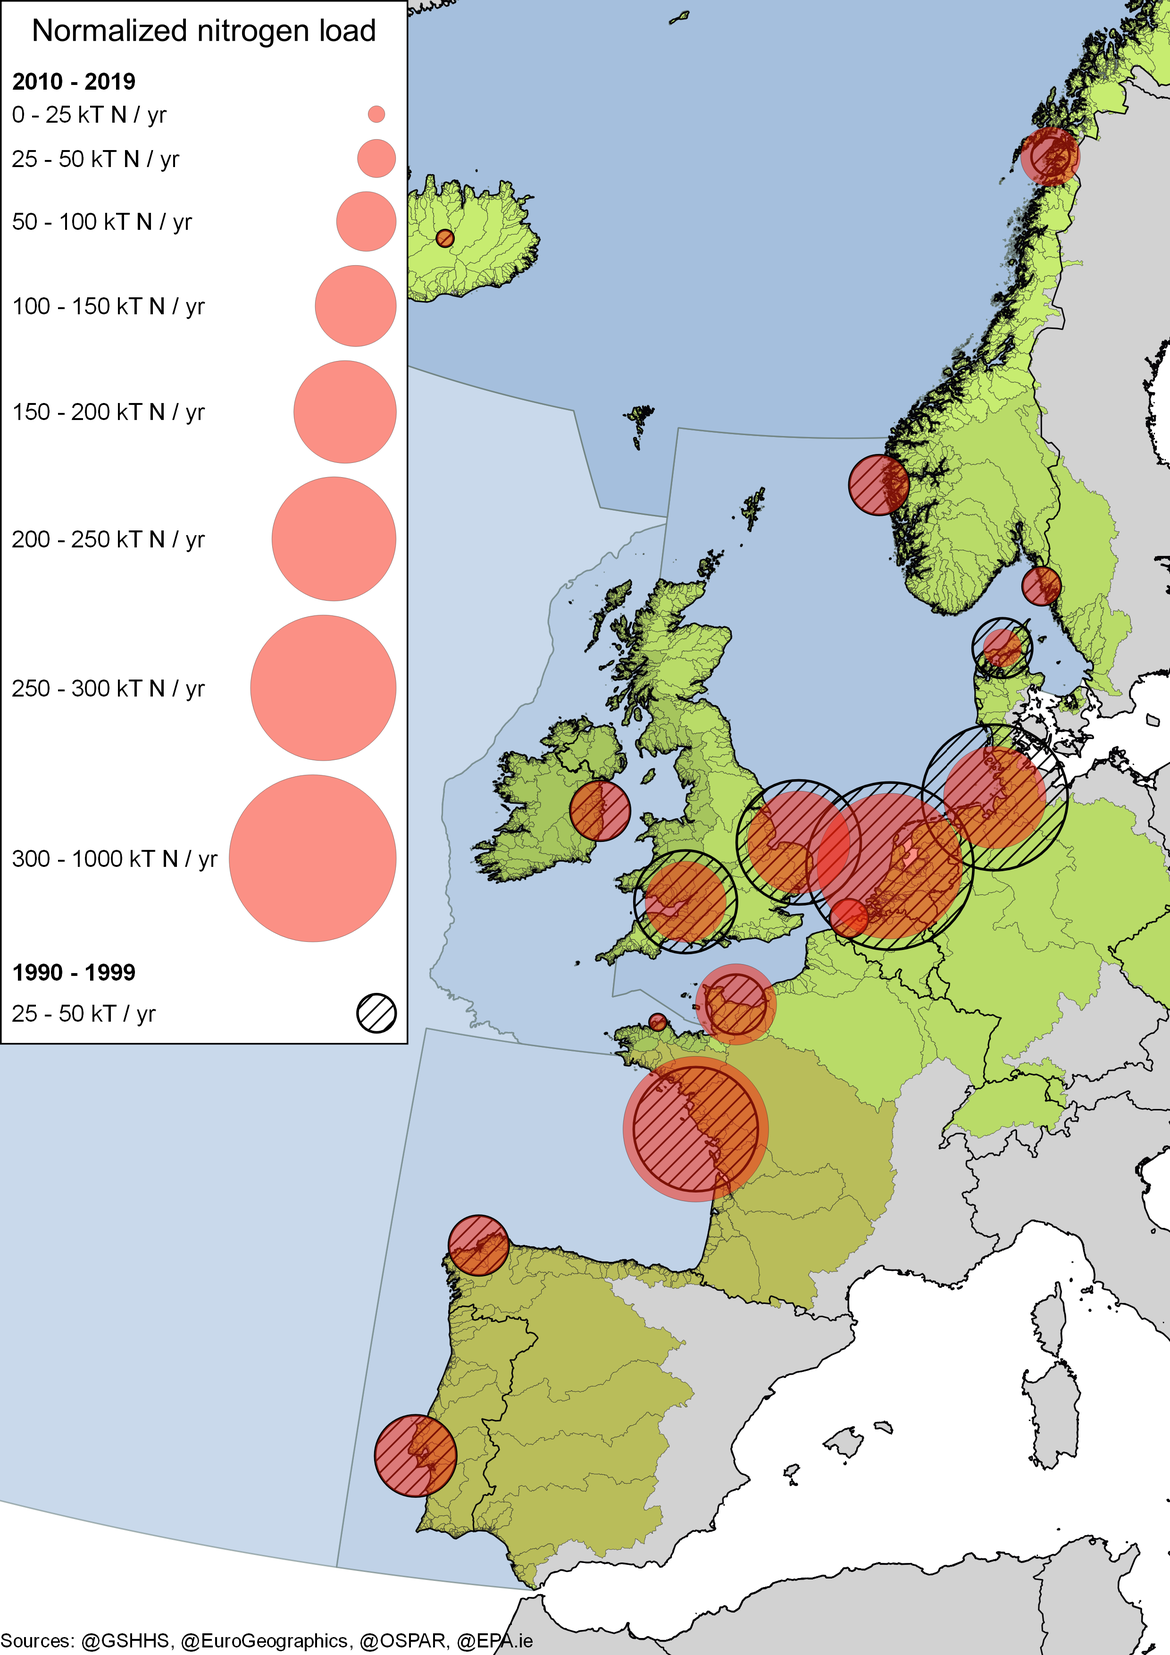
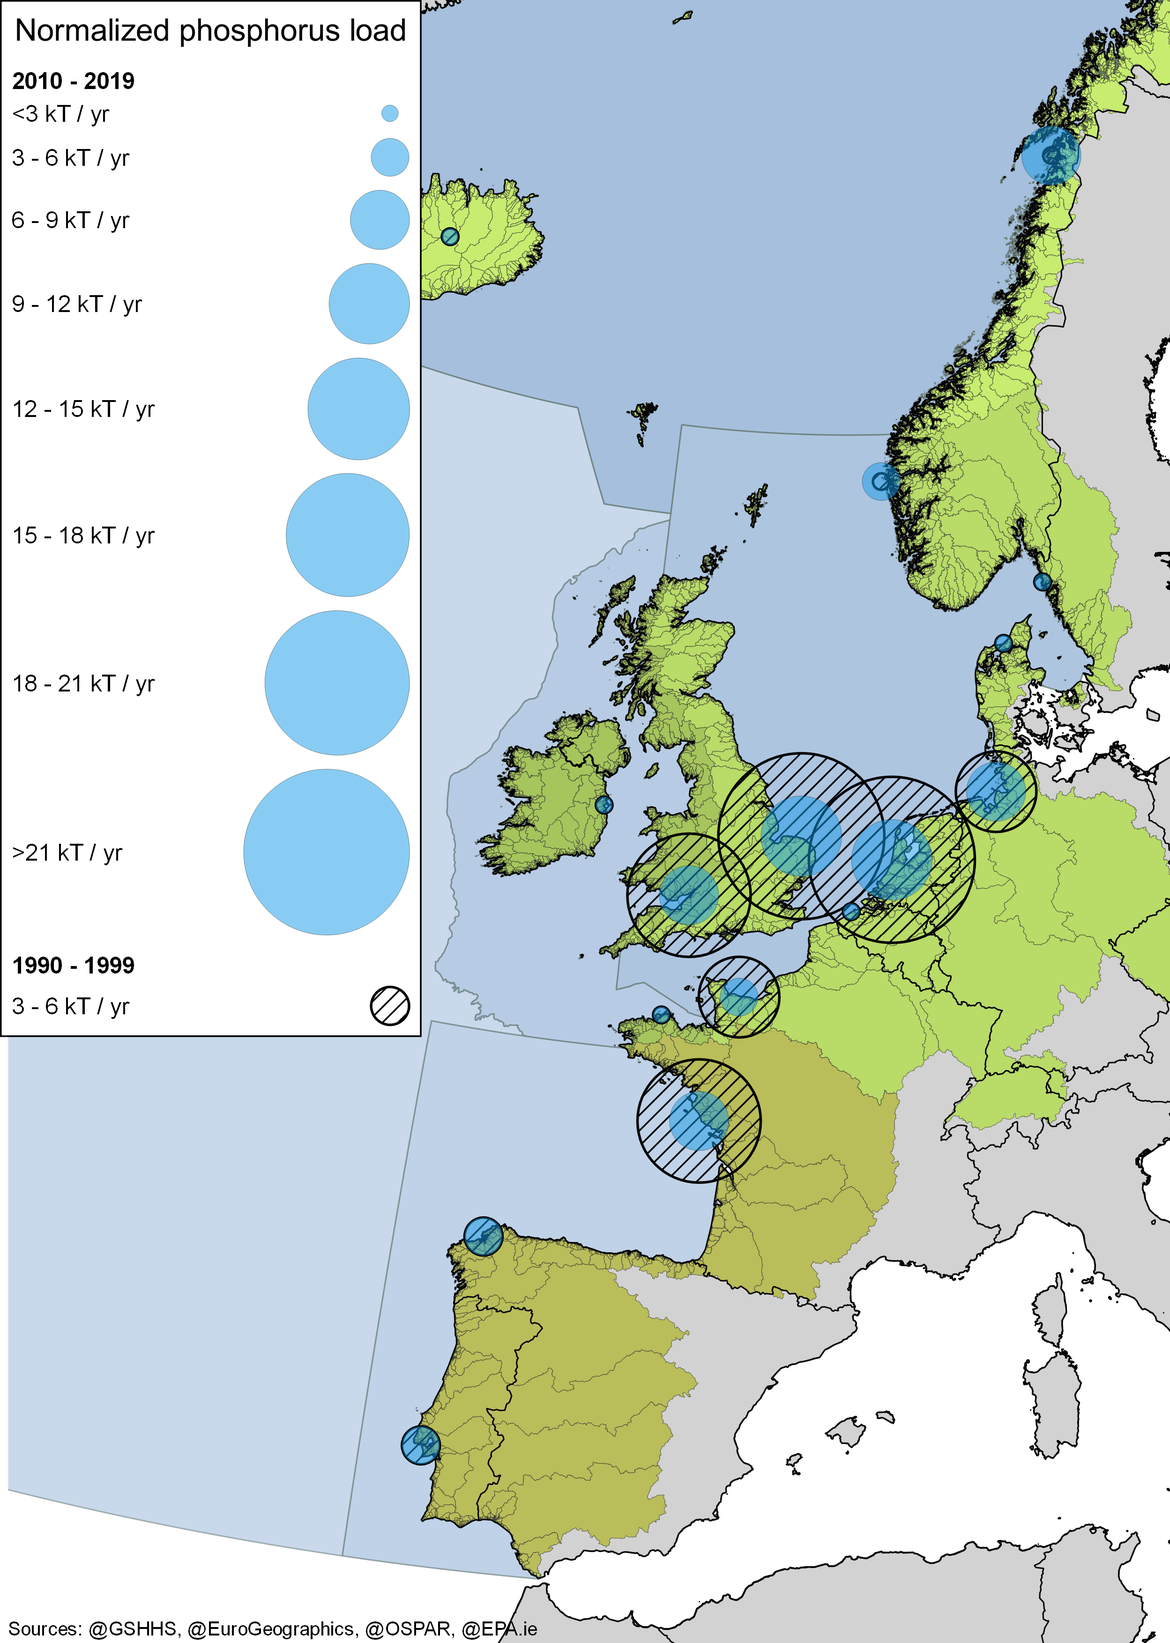
Figure P.3: Relative changes in nitrogen (left) and phosphorus (right) inputs from selected major catchments for the period 2010 - 2019 compared to 1990 – 1999. Catchments selected are those shown in the 3rd Common Procedure report (OSPAR, 2015).
N.B. The United Kingdom reports Total Inorganic Nitrogen and Total Inorganic Phosphorus, not Total Nitrogen and Total Phosphorus by persulphate oxidation. This results in a lower estimated input from the United Kingdom than would otherwise be expected.
The increase in nutrient inputs to the Arctic is of potential concern. While the total amount of nitrogen entering Region I because of reduced atmospheric emissions is decreasing, the waterborne amount has almost tripled since 1990 (Figure P.4). The increase is likely to be an underestimate as no direct discharge data have been reported for Iceland or the Faroe Islands, which both have aquaculture industries. The aquaculture inputs occur on the coast, whereas the reduction in atmospheric inputs is spread across the whole region, so there is likely a process of oligotrophication occurring offshore with potential for eutrophication on the coast.
Figure P.4: Waterborne nitrogen and phosphorus inputs to the Arctic (Region I)
In addition, the effects of eutrophication are increased by pressures from:
Climate change ( Climate Change Thematic Assessment and Ocean Acidification Other Assessment ):
Numerous drivers and activities (e.g. burning of fossil fuels, agriculture, deforestation) contribute to climate change, with a number of associated pressures potentially linked to eutrophication. Projections of climate change impacts on eutrophication are uncertain, however. They are linked to factors such as land use and crop choice, rainfall patterns and resulting freshwater input and run-off, and storminess affecting turbidity. Sea temperature, freshwater inputs and storminess affect the onset and breakdown of stratification.
These pressures change the biogeochemistry related to eutrophication directly and indirectly. Direct impacts, such as increased temperature, result in reduced oxygen concentrations by increasing phytoplankton growth rates and bacterial decomposition rates. Indirect impacts occur where, for example, increased stratification leads to reduced oxygen exchange in the water column, which in turn increases the risk of hypoxic events affecting both marine fauna and macrophytes.
| Activities | State |