

Assessing the state of pelagic habitats
Pelagic habitats in the OSPAR Maritime Area have experienced widespread changes over the past 60 years. Climate change (both from natural variability and human-induced) is probably the greatest pressure currently impacting pelagic habitats. Measures put in place to control nutrient inputs in the Greater North Sea and Celtic Seas may be limiting productivity. There was a general pattern of decreasing phytoplankton and zooplankton abundance and/or biomass across the three OSPAR Regions considered in the indicator assessments (i.e., Greater North Sea, Celtic Seas, Bay of Biscay and Iberian Coast), which will probably have consequences for higher food web levels. Due to widespread changes linked to human pressures across multiple pelagic habitat types (Table S.1; Figure S.1) with medium to high confidence (Table S.2), the three OSPAR Regions considered in the indicator assessments were all in not good environmental status under the definition and categorisation of quality status described in McQuatters-Gollop et al. (2022).

Figure S.1: Integrated status assessment schematic for pelagic habitat types (variable salinity habitats, coastal habitats, shelf habitats, oceanic/beyond shelf habitats) in the assessed OSPAR Regions
Table S.1: The biodiversity status of pelagic habitats in each OSPAR Region, derived by integrating the status of pelagic habitat types
| Arctic Waters (Region I) | Greater North Sea (Region II) | Celtic Seas (Region III) | Bay of Biscay and Iberian Coast (Region IV) | Wider Atlantic (Region V) |
|---|---|---|---|---|
| Not assessed | Not in good environmental status | Not in good environmental status | Not in good environmental status | Not assessed |
Table S.2: Confidence assessment results across the five OSPAR Regions, determined using the methodology outlined in the QSR guidance
| OSPAR Region | Arctic Waters (Region I) | Greater North Sea (Region II) | Celtic Seas (Region III) | Bay of Biscay and Iberian Coast (Region IV) | Wider Atlantic (Region V) |
|---|---|---|---|---|---|
| Confidence | Not assessed | Medium | High | Medium | Not assessed |
OSPAR acts as a coordination platform in the North-East Atlantic for the regional implementation of the EU Marine Strategy Framework Directive (MSFD) that aims to achieve a Good Environmental Status (GES) in European marine environments, as well as for the coordination of other national frameworks. The characteristics of GES are determined by the individual EU member states, based on criteria elements, threshold values and methodological standards set regionally or at EU level. Norwegian, Icelandic, United Kingdom, Greenlandic and Faroese marine areas are not covered by the MSFD.
Specific impacts on the state of pelagic systems include changes in food webs and loss of energy transfer from pelagic systems to higher trophic levels. Knock-on impacts can include changes in the strength of coupling between pelagic and benthic systems. Such changes can be detected through variation in benthic productivity and reproduction. In localised areas eutrophication impacts can lead to a dominance of problematic species, including harmful-bloom-forming phytoplankton; however, not all large phytoplankton blooms are in themselves harmful (Figure S.2). Eutrophication can be managed by controlling the flow of anthropogenic nutrients entering rivers, and by setting environmental targets.
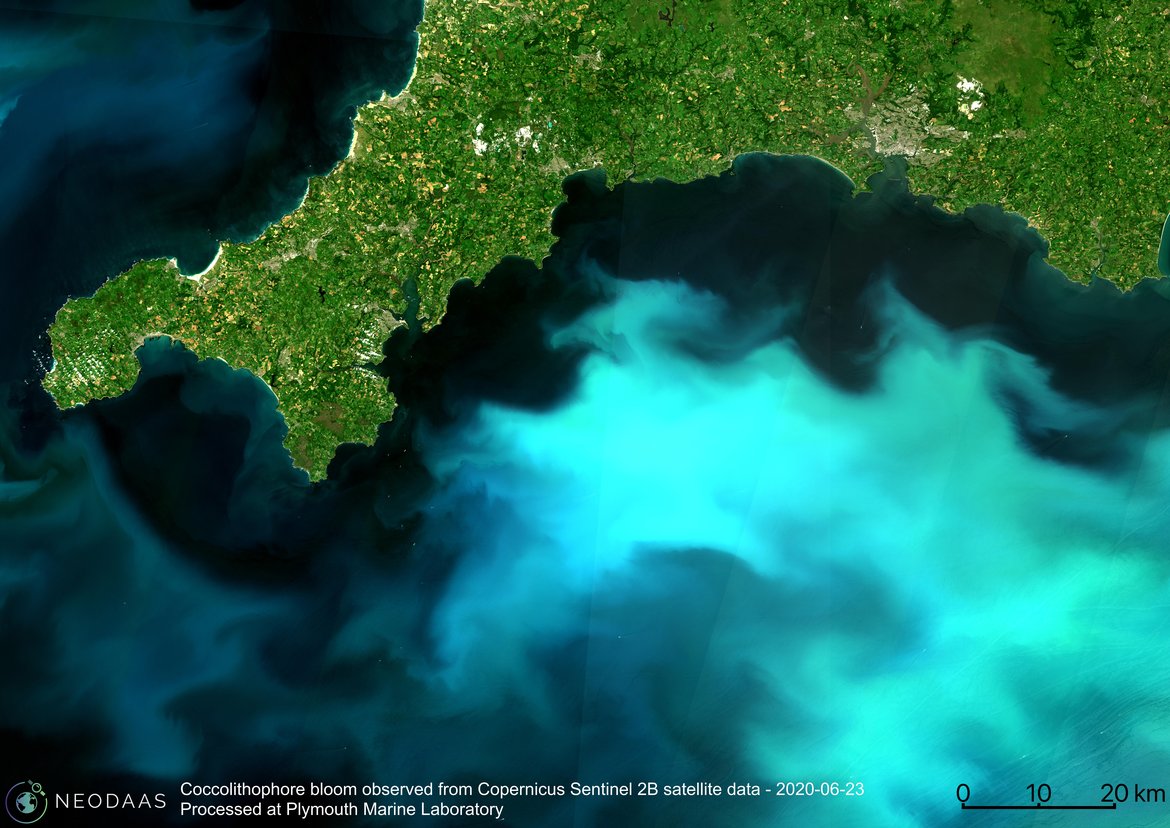
Figure S.2: Copernicus Sentinel 2B Image showing a short-lived coccolithophore bloom off the south-west coast of England in June 2020. Image processed at Plymouth Marine Laboratory by the NERC Earth Observation Data Acquisition and Analysis Service (NEODAAS). Image credit: Daniel Clewley
Climate change can alter the local ecological conditions of pelagic habitats and affect the abundance of species, their life history traits and physiology and the composition of biological communities. However, unlike eutrophication, which can be managed at local or regional scale, climate change must be managed globally for any mitigation efforts to be effective.
The environmental impacts relating to an undesirable state in pelagic habitats can include:
- Changes in food available (both quantity and quality) for higher trophic levels;
- Productivity impacts across trophic levels;
- Reduction in the concentration of dissolved oxygen leading to negative change in plankton functional groups or lifeforms;
- Changes in energy flow between phytoplankton and zooplankton;
- Changes in benthic-pelagic coupling and reproductive output;
- Eutrophication leading to less desirable food webs;
- Introduction and spreading of NIS;
- Changes in phenology, or mistiming of seasonal events, due to climate change;
- Changes in carbonate chemistry and the cycling of key elements, including carbon, nitrogen, phosphorus, and silica.
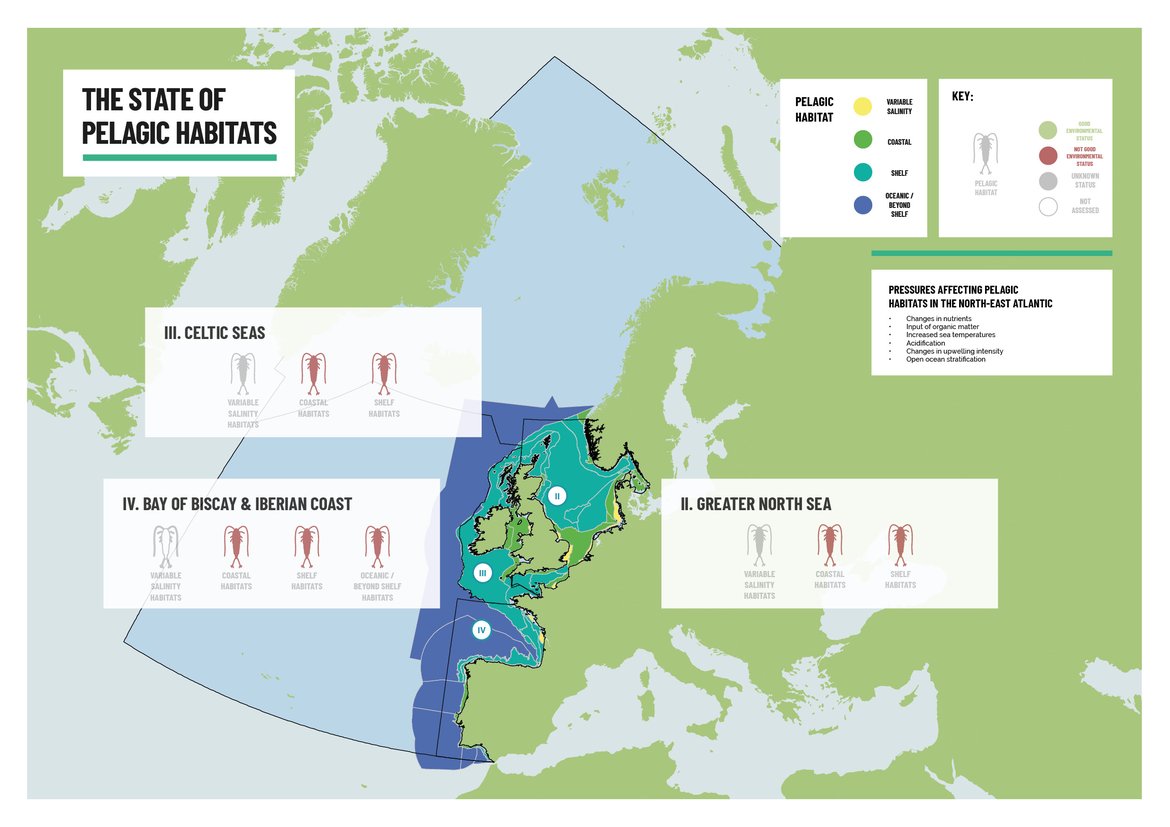
Figure S.3: Indicator results schematic for pelagic habitat types (variable salinity, coastal, shelf, and oceanic / beyond shelf habitats) within the OSPAR Regions assessed for the pelagic habitats indicator assessments.This graphic has been designed to follow the format outlined in McQuatters-Gollop et al. (2022)
For the OSPAR pelagic habitat biodiversity indicators there was variability among indicators, pelagic habitat types and OSPAR Regions. Icons have been coloured according to indicator status. Grey colour for unknown is the default colour if the indicator has been assessed. Red indicates that the assessment detected a trend and that the trend is linked to a human activity (not good). Current integration methods for pelagic habitats do not allow for the determination of good status, due to uncertainty around conditions not significantly affected by anthropogenic pressures. White identifies indicators that were not assessed in some Regions or habitat types due to lack of data. Pelagic habitat types without results displayed indicate that the particular habitat type is not present within the OSPAR Region. Grey background and “pilot” labelling indicate that an indicator has candidate status in the respective Region and that a pilot assessment has been prepared.
For the current assessment, changes in the state of pelagic habitats in Greater North Seas, Celtic Seas and Bay of Biscay and Iberian coast (OSPAR Regions II, III, and IV) were evaluated over the period between 1960 and 2019 (except for phytoplankton biomass, which was assessed between 1998 and 2019) through analysis of three common biodiversity indicators:
- Changes in Phytoplankton and Zooplankton Communities (PH1/FW5);
- Changes in Phytoplankton Biomass and Zooplankton Abundance (PH2);
- Changes in Plankton Diversity (PH3).
Changes in Phytoplankton and Zooplankton Communities (PH1/FW5) is an indicator of ecosystem function which measures changes in the abundance of important plankton functional groups or “lifeforms”.
Changes in Phytoplankton Biomass and Zooplankton Abundance (PH2) is a bulk indicator which examines changes in the abundance of copepods (the largest contributor to total zooplankton abundance) and changes in the biomass of phytoplankton (the main marine primary producers) (Figure S.4).
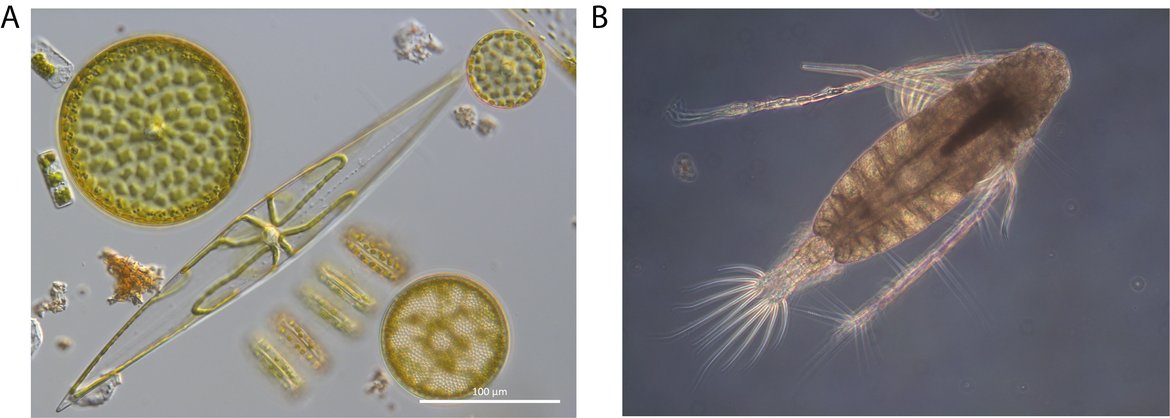
Figure S.4: The changes in plankton biomass and/or abundance (PH2) common indicator measures changes in the total biomass of phytoplankton, including pennate and centric diatoms (A). This common indicator also measures changes in the abundance of copepods such as the calanoid copepod Acartia tonsa (B). Image credits: Claire Widdicombe (A), Tanja Burgmer (B)
Changes in Plankton Diversity (PH3) is a biodiversity indicator which examines changes in composition, species turnover and dominance within phytoplankton and zooplankton communities. For the current assessment, PH3 was evaluated as a common indicator in the Celtic Seas (OSPAR Region III) and as a candidate indicator in the Greater North Sea and the Bay of Biscay and Iberian Coast (OSPAR Regions II and IV, respectively; Table S.3). While the results of the pilot assessment of PH3 were included in this Thematic Assessment, they were not considered in the region-specific summary or confidence assessment for pelagic habitats in the Greater North Sea and Bay of Biscay and Iberian Coast (OSPAR Regions II and IV), since PH3 is not currently a common indicator in those Regions.
Table S.3: The status of how each indicator was considered or evaluated across the five OSPAR Regions
| Arctic Waters (Region I) | Greater North Sea (Region II) | Celtic Seas (Region III) | Bay of Biscay and Iberian Coast (Region IV) | Wider Atlantic (Region V) | |
|---|---|---|---|---|---|
| Changes in Phytoplankton and Zooplankton Communities (PH1/FW5) | Not assessed | Common | Common | Common | Not assessed |
| Changes in Phytoplankton Biomass and Zooplankton Abundance (PH2) | Not assessed | Common | Common | Common | Not assessed |
| Changes in Plankton Diversity (PH3) | Not assessed | Pilot assessment | Common | Pilot assessment | Not assessed |
These indicators were analysed to evaluate biological changes occurring across a set of assessment units and fixed-point stations within the OSPAR Maritime Area. The "OSPAR Common Procedure Assessment Units" (Common Procedure for the Identification of the Eutrophication Status of the OSPAR Maritime Area, 4th application), an OSPAR data product, were used to spatially subdivide plankton samples (Figure S.5). These assessment units are a geographical representation of the conditions most likely to drive plankton distribution, dynamics and community composition.
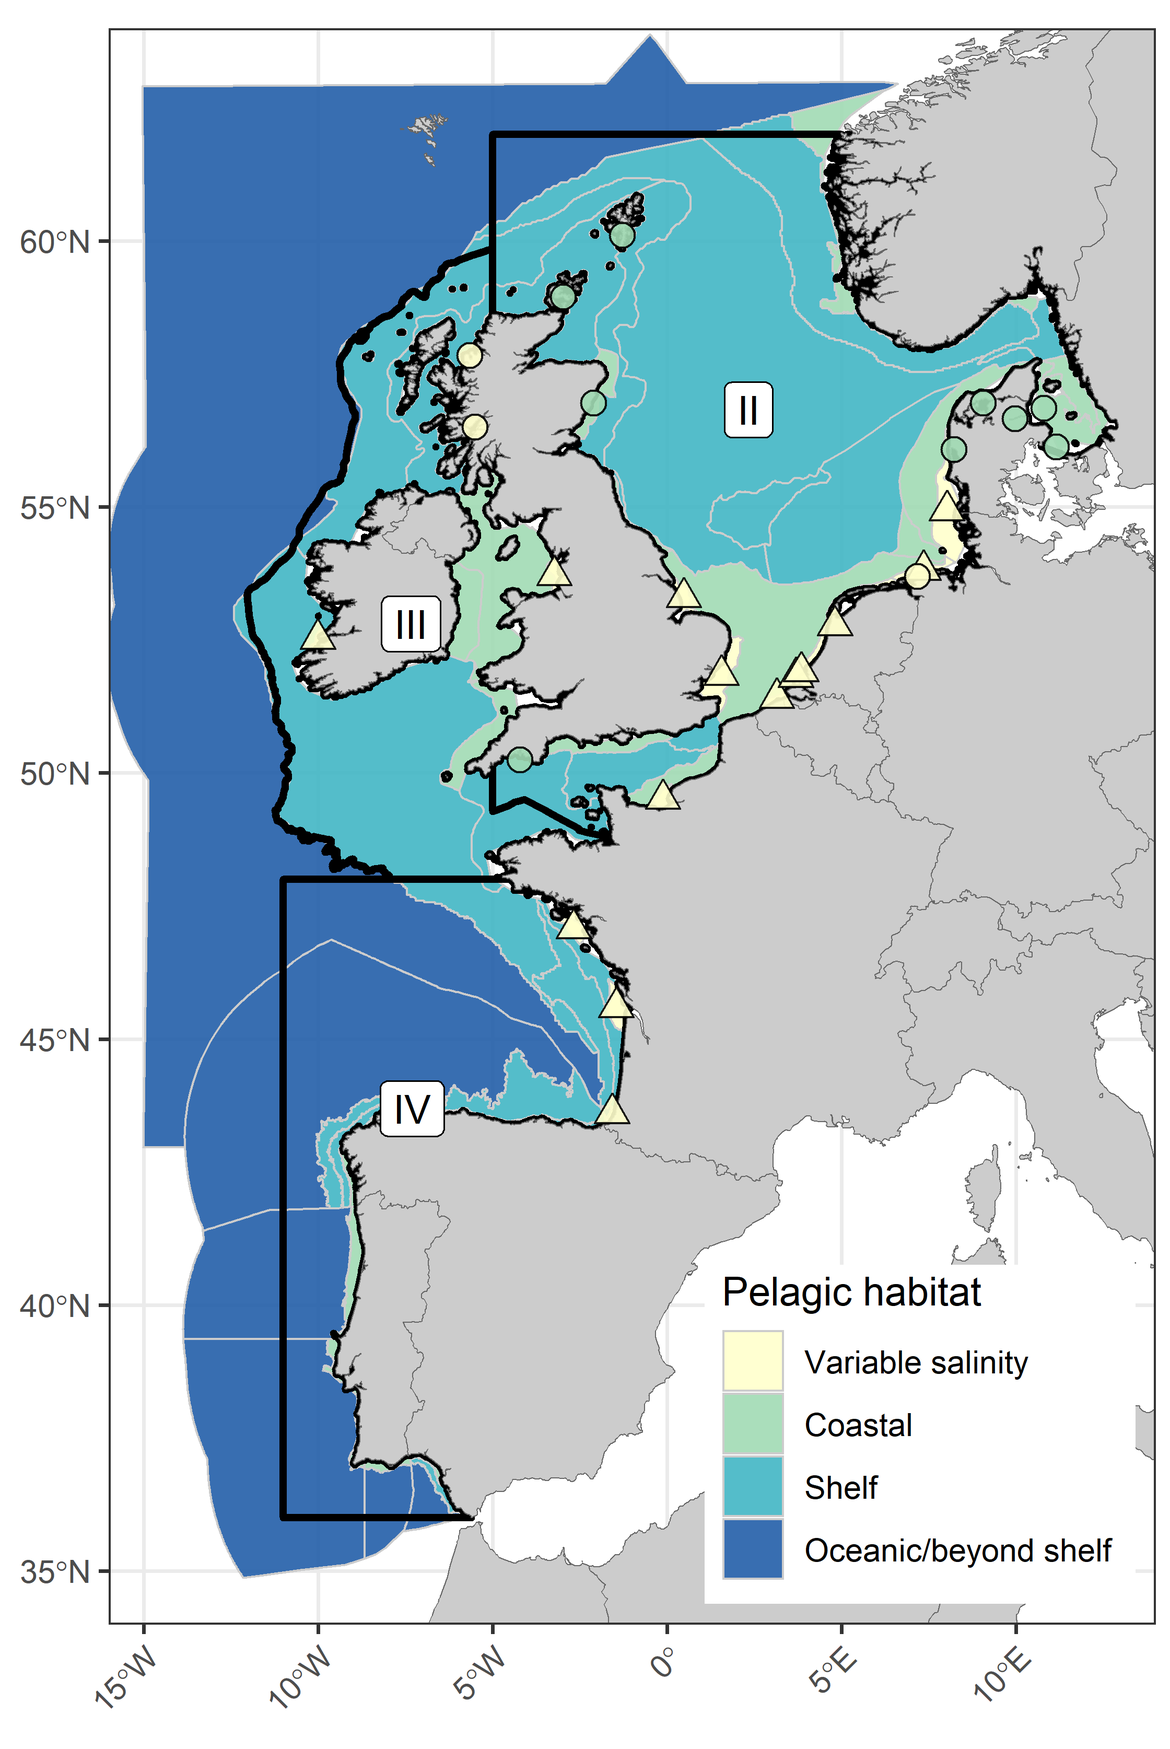
Figure S.5: The distribution of the four pelagic habitat types across the three OSPAR Regions considered in the pelagic habitat indicator assessments, and the boundaries of the five OSPAR Regions across the OSPAR Maritime Area (inset). Fixed-point stations are represented as circles and river plumes are represented as triangles. Boundaries between COMP4 assessment units used in this assessment are indicated in grey
For OSPAR Regions II, III and IV, assessment units and fixed-point stations were grouped according to four pelagic habitat types so that indicator results could be integrated by habitat (Figure S.5). The intention of this approach was to provide broad overarching conclusions on the state of pelagic habitats within each OSPAR Region, despite likely important differences among assessment units of the same habitat type. For a more detailed description of indicator results at the scale of the individual assessment units, consult the pelagic habitats indicator assessments: Changes in Phytoplankton and Zooplankton Communities (PH1/FW5); Changes in Phytoplankton Biomass and Zooplankton Abundance (PH2); Changes in Plankton Diversity (PH3).
The habitat type categories were created to align assessment outputs with EU MSFD features, with a view to allowing Contracting Parties to use the information for MSFD Art. 8 reporting. The four pelagic habitat types used in the assessment were:
- Variable salinity habitats;
- Coastal habitats;
- Shelf habitats;
- Oceanic / beyond shelf habitats.
Variable salinity habitats were defined according to EU GES Decision 2017/848 for situations where estuarine plumes extend beyond waters designated as Transitional Waters under Directive 2000/60/EC.
Coastal habitats were defined according to EU GES Decision 2017/848. ‘Coastal’ is to be understood on the basis of physical, hydrological and ecological parameters and is not limited to coastal water as defined in Article 2(7) of Directive 2000/60/EC (WFD).
Shelf habitats were defined according to a mean salinity threshold of >34.5 as the boundary between outer coastal and offshore waters, as defined in OSPAR Agreement 13-08, and as used for nutrients in the previous Common Indicator Assessment IA 2017. For future assessment, this salinity threshold should be reassessed, as isohaline boundaries will probably be impacted by salinity changes already occurring in the wider Atlantic.
Oceanic / beyond shelf habitats were defined according to a mean depth threshold of >200 m.
Indicator assessment results were integrated across common indicators for the four pelagic habitat types (Table S.4) to ultimately facilitate determination of a single status for each OSPAR Region, see: CEMP Guideline for Pelagic Habitats Thematic Assessment Integration Method. The status for each pelagic habitat type was determined by majority status. However, in the case of a tie when only two indicators were common and one of the two indicators was detecting a trend linked to human activity (not good) status, the status for the habitat type was also not good. In cases where a common indicator was not assessed within a particular pelagic habitat type, the status for that habitat would only consider the indicators which were assessed.
Table S.4: The status for each pelagic habitat type within each OSPAR Region, derived by integrating the status of common indicators for pelagic habitats. Diagonally hatched cells indicate that an indicator has candidate status in a particular Region and a pilot assessment has been produced. As the PH3 indicator remains a candidate indicator for OSPAR Regions II and IV, the status of PH3 for these Regions is given for information purposes only and was not considered in the integration of overall habitat or Region status
| Region | Habitat | PH1/FW5 | PH2 | PH3 | Habitat Status | Region Status |
|---|---|---|---|---|---|---|
| Greater North Sea (Region II) | Variable salinity | Unknown | Unknown | Not good | Unknown | Not good |
| Coastal | Unknown | Detected trend linked to human activity | Not good | Not good | ||
| Shelf | Detected trend linked to human activity | Detected trend linked to human activity | Unknown | Not good | ||
| Oceanic | Not assessed | Not assessed | Not assessed | Not assessed | ||
| Celtic Seas (Region III) | Variable salinity | Unknown | Unknown | Not assessed | Unknown | Not good |
| Coastal | Detected trend linked to human activity | Detected trend linked to human activity | Detected trend linked to human activity | Not good | ||
| Shelf | Detected trend linked to human activity | Detected trend linked to human activity | Unknown | Not good | ||
| Oceanic | Not assessed | Not assessed | Not assessed | Not assessed | ||
| Bay of Biscay and the Iberian Coast (Region IV) | Variable salinity | Not assessed | Not assessed | Not assessed | Not assessed | Not good |
| Coastal | Unknown | Detected trend linked to human activity | Not good | Not good | ||
| Shelf | Detected trend linked to human activity | Detected trend linked to human activity | Unknown | Not good | ||
| Oceanic | Detected trend linked to human activity | Detected trend linked to human activity | Unknown | Not good |
The overall status for each OSPAR Region (Table S.4) was also determined by majority status among the pelagic habitats it contains. However, in the case of a tie when only two pelagic habitat types were assessed and one of the two habitat types was in not good status, the status for the habitat type was also not good. In cases where the status for a particular pelagic habitat type was not assessed, the status for that OSPAR Region only considered the habitats which were assessed.
In the following section the current state of pelagic habitats across the five OSPAR Regions has been summarised by discussing current peer-reviewed literature. This review is complemented by integrating the results of the indicator assessments, wherever they were considered a common indicator.
Confidence assessment
A confidence assessment was conducted according to the recommendations in the QSR Guidance and confidence scores were integrated according to the CEMP Guideline for the Pelagic Habitats Thematic Assessment. The overall confidence score for each OSPAR Region was determined by considering the type, amount, quality, and consistency of evidence (i.e., Robust, Medium, or Limited) as well as the degree of agreement (i.e., High, Medium, or Low) in the results among the indicator assessments.
The confidence assessment also incorporated the temporal extent of plankton monitoring time-series. While offshore areas were extensively surveyed from 1960 by the Continuous Plankton Recorder (CPR) programme, coastal areas and river plumes had shorter time-series, typically commencing between 1980 and 2000.
Each indicator assessment also included its own internal confidence assessment, which considered the spatial distribution of samples within each assessment unit as well as the temporal distribution of samples within each time-series. Evidence and agreement scores were used to determine a combined score, using the matrix method outlined in the QSR Guidance (Table S.5). Agreement and evidence scores for each OSPAR Region (Table S.6), as well as the rationale for selecting them, are described below.
Table S.5: A depiction of the evidence and agreement statement and their relationship to the confidence criteria from the QSR Guidance. An overall confidence score is determined by locating the appropriate agreement and evidence scores in the matrix and selecting a confidence score with the same fill colour in the bottom table
High agreement | High agreement | High agreement |
Medium agreement | Medium agreement | Medium agreement |
Low agreement | Low agreement | Low agreement |
Overall confidence:
| Very low | Low | Medium | High | Very high |
Table S.6: Confidence assessment of the type, amount, quality, and consistency of evidence (i.e., Robust, Medium, or Limited), as well as the degree of agreement in the results (i.e., High, Medium, or Low), for the three pelagic habitat indicators across the five OSPAR Regions. Colours are used for interpretation. Diagonally hatched cells indicate that an indicator has candidate status in the Region and that, while a pilot assessment has been conducted, a confidence assessment has not been produced
| Region | Criteria | PH1/FW5 | PH2 | PH3 | Criteria Status | Region Status |
|---|---|---|---|---|---|---|
| Greater North Sea (Region II) | Agreement | Medium | Medium | Not assessed | Medium | Medium |
| Evidence | Medium | Medium | Not assessed | Medium | ||
| Celtic Seas (Region III) | Agreement | High | High | High | High | High |
| Evidence | Medium | Medium | Medium | Medium | ||
| Bay of Biscay and the Iberian Coast (Region IV) | Agreement | High | High | Not assessed | High | Medium |
| Evidence | Limited | Limited | Not assessed | Limited |
Pelagic habitats in the Greater North Sea (Region II)
PH1/FW5: Medium
Agreement: Medium
While some lifeforms demonstrated consistent trends across multiple pelagic habitats, others showed variable trends. Changes in meroplankton were strongly supported by the literature. Due to high variability in the ranking of pressures, links between trends in the indicator and pressures were only clear for shelf habitats. This may be a reflection of the higher complexity of direct and indirect pressures exerted on coastal and variable salinity pelagic habitats.
Evidence: Medium
There were multiple datasets supporting this indicator assessment, providing nearly full coverage of all assessment units within coastal and shelf habitats. The temporal scale of the assessment also spanned more than six decades for many of the offshore areas. However, zooplankton lifeforms within variable salinity habitats were poorly represented. Pressure datasets were also primarily sourced from satellite remote sensing and hydrodynamic / ecological models, rather than in situ sampling.
PH2: Medium
Agreement: Medium
The overall trend was consistent across the three pelagic habitats and both plankton components. However, local-scale results showed some variability, which was reduced once results were integrated within pelagic habitats. The local direction of changes, as well as the pressures responsible for the changes, were supported by current literature (e.g., Capuzzo et al., 2018).
Evidence: Medium
The Greater North Sea benefits from multiple datasets obtained by various observing systems (e.g. satellite sensors, fixed monitoring stations, non-station data from “ships of opportunity” or research vessels) with coverage across all assessment units. However, zooplankton lifeforms within variable salinity habitats were poorly represented. The temporal scale of the assessment spanned more than three decades, revealing robust trends as well as links to pressures.
PH3: Not assessed
A pilot assessment of the PH3 indicator was also produced for the Greater North Sea (OSPAR Region II). However, since the PH3 indicator is only a candidate indicator in this Region it did not contribute to the overall confidence scoring. For further information, please consult the PH3 indicator assessment: Changes in Plankton Diversity (PH3).
Pelagic habitats in the Celtic Seas (Region III)
PH1/FW5: High
Agreement: High
The indicator demonstrates consistent downward trends across multiple pelagic habitats. Linkage between trends in indicator and pressures show some variability among lifeforms, but mostly consistent within pelagic habitats.
Evidence: Medium
There were multiple datasets supporting this indicator assessment, with full coverage of all assessment units within coastal and shelf habitats. The temporal scale of the assessment also spanned more than six decades for many of the offshore areas. However, zooplankton lifeforms within variable salinity habitats were poorly represented. Pressure datasets were also primarily sourced from satellite remote sensing and hydrodynamic / ecological models rather than by in situ sampling.
PH2: High
Agreement: High
There was generally low variability in the direction and magnitude of trends among assessment units comprising each pelagic habitat type. Phytoplankton and zooplankton exhibited different linkages between indicator trends and relevant pressures, but these linkages remained consistent across pelagic habitats.
Evidence: Medium
The Celtic Seas Region benefits from multiple datasets obtained by various observing systems (e.g., satellite sensors, fixed monitoring stations, non-station data from “ships of opportunity” or research vessels) with coverage across all assessment units. However, zooplankton lifeforms within variable salinity habitats were poorly represented. The temporal scale of the assessment spanned more than three decades, revealing robust trends as well as links to pressures.
PH3: High
Agreement: High
There was generally low variability in the direction and magnitude of trends among assessment units comprising the pelagic habitat types. Phytoplankton and zooplankton exhibited different linkages between indicator trends and relevant pressures, but these linkages remained consistent across pelagic habitats.
Evidence: Medium
No data were available for phytoplankton and zooplankton in the variable salinity habitats. However, coastal and shelf habitats benefited from long-term monitoring (commencing in 1960), which provided coverage across all assessment units.
Pelagic habitats in the Bay of Biscay and Iberian coast (Region IV)
PH1/FW5: Medium
Agreement: High
The indicator demonstrated consistent downward trends for most planktonic lifeforms across multiple pelagic habitats. Linkage between trends in the indicator and pressures showed some variability among lifeforms but was mostly consistent within pelagic habitats. Downward trends in shelf and offshore areas were supported by literature (e.g., Edwards et al., 2022).
Evidence: Limited
The temporal scale of the assessment in shelf and oceanic / beyond shelf habitats spanned more than six decades for many of the offshore areas. However, there were no data available for zooplankton lifeforms in variable salinity or coastal habitats and phytoplankton lifeforms in coastal habitats were poorly represented. Similarly, shelf and oceanic / beyond shelf habitats were only partially represented. Pressure datasets were also primarily sourced from hydrodynamic / ecological models rather than by in situ sampling. Further, since the assessment units in the Bay of Biscay and Iberian Coast had to be defined with a different methodology from that used for the Greater North Sea and Celtic Seas, they may not be fully representative of the oceanography and plankton dynamics of the Region.
PH2: Medium
Agreement: High
There was generally low variability in the direction and magnitude of trends among assessment units comprising the pelagic habitat types. Phytoplankton and zooplankton exhibited different linkages between indicator trends and relevant pressures, but these linkages remained consistent, with strong evidence supporting them across pelagic habitats.
Evidence: Limited
No data were available to evaluate both phytoplankton and zooplankton within variable salinity habitats. No assessment units were represented for coastal habitats, and the only data available were from fixed-point reference stations. Shelf and oceanic habitats were also poorly represented due to limited spatiotemporal coverage of CPR samples. Further, since assessment units in the Bay of Biscay and Iberian Coast had to be defined with a different methodology from that used for the Greater North Sea and Celtic Seas, they may not be fully representative of the oceanography and plankton dynamics of the Region.
PH3: Not assessed
A pilot assessment of the PH3 indicator was also assessed for the Bay of Biscay and Iberian Coast (OSPAR Region IV). However, since the PH3 indicator is only a candidate indicator in the Bay of Biscay and Iberian Coast, it did not contribute to the overall confidence scoring. For further information, please consult the PH3 indicator assessment: Changes in Plankton Diversity (PH3).
Region-specific summary
Pelagic habitats in Arctic Waters (Region I)
The region-specific summary for Arctic Waters (OSPAR Region I) has been entirely based on the scientific literature, since no indicator assessments were conducted in this Region.
Region I consists of Atlantic and Arctic waters. In its Atlantic waters, phytoplankton are present throughout the year, with seasonal and annual fluctuations among species (Dale et al., 1999). Phytoplankton are eaten by herbivorous zooplankton, with Calanus the biomass-dominant genus, particularly Calanus finmarchicus, but there are also several other genera. Carnivorous zooplankton belong to a range of taxa, including pelagic amphipods, gelatinous zooplankton, chaetognaths, and omnivorous krill (Melle et al., 2004). Calanus abundance has fallen below the long-time average since the early 2000s, with few fluctuations (ICES, 2020a). Likewise, euphausiid abundance has declined substantially in the surface waters south of 65°N since the 1960s (Edwards et al., 2021).
In the Arctic portion of Region I, where sea surface temperatures have increased and ice cover has diminished (Dahlke et al., 2020), changes in phytoplankton bloom time and in zooplankton communities have been found (Dalpadado et al., 2020), leading to temporal mismatch between predators and their prey. There has also been a decline in Arctic copepods, particularly Calanus glacialis, and the amphipod Themisto libellula, in the warmest years (Aarflot et al., 2018; Stige et al., 2019). Arctic pelagic habitats are continuing to resemble boreal pelagic habitats, driving a doubling in the biomass of krill (Eriksen et al., 2016; 2017). Finally, Calanus finmarchichus has shifted its distribution further north into waters which were previously too cold for it to occupy (ICES, 2020b).
Pelagic habitats in the Greater North Sea (Region II)
The status for variable salinity habitats in Region II was unknown, since this was the status for both: PH1/FW5 Changes in Phytoplankton and Zooplankton Communities and PH2 Changes in Phytoplankton Biomass and Zooplankton Abundance indicators (Table S.7). The status for coastal habitats was not good, since the status for the PH2 indicator was a trend linked to a human activity (interpreted as not good), while the PH1/FW5 result was unknown. The status for shelf habitats was not good, since this was the result for both PH1/FW5 and PH2 indicators. Considering that coastal and shelf habitats had not good status while only variable salinity habitats had unknown status (Table S.7), the status for pelagic habitats in the Greater North Sea (Region II) was not good. The integration of confidence scores for common indicators in the Greater North Sea resulted in an overall score of Medium for this OSPAR Region (Table S.8).
Table S.7: The status for each Common and Candidate indicator within each pelagic habitat type for the Greater North Sea (OSPAR Region II), derived from the integration of results for each indicator. Diagonally hatched cells indicate that an indicator has candidate status in the Region and that a pilot assessment has been produced. PH3 results have been presented for information purposes only
| Region | Habitat | PH1/FW5 | PH2 | PH3 | Habitat Status | Region Status |
|---|---|---|---|---|---|---|
| Greater North Sea (Region II) | Variable salinity | Unknown | Unknown | Not good | Unknown | Not good |
| Coastal | Unknown | Detected trend linked to human activity | Not good | Not good | ||
| Shelf | Detected trend linked to human activity | Detected trend linked to human activity | Unknown | Not good | ||
| Oceanic | Not assessed | Not assessed | Not good | Not assessed |
A pilot assessment of the PH3 indicator was also produced for the Greater North Sea (OSPAR Region II). However, since the PH3 indicator is only a candidate indicator in the present region, the results are not described in detail below. For further information, please consult the PH3 indicator assessment, Changes in Plankton Diversity .
Table S.8: Confidence assessment of the type, amount, quality, and consistency of evidence (i.e. Robust, Medium, or Limited), as well as the degree of agreement in the results (i.e. High, Medium, or Low) for the pelagic habitat indicators assessed in the Greater North Sea (OSPAR Region II). Colours are used for interpretation. Diagonally hatched cells indicate that an indicator has candidate status in the Region and that, while a pilot assessment has been conducted, a confidence assessment has not been produced
| Region | Habitat | PH1/FW5 | PH2 | PH3 | Habitat Status | Region Status |
|---|---|---|---|---|---|---|
| Greater North Sea (Region II) | Agreement | Medium | Medium | Not assessed | Medium | Medium |
| Evidence | Medium | Medium | Not assessed | Medium |
The Greater North Sea (Region II) experiences regular eutrophication events, particularly along shorelines in the southern part, where several large rivers input nutrients released from agricultural practices, sewage discharge and natural processes (Van der Zande et al., 2019). For QSR 2023, the Eutrophication Thematic Assessment has emphasised the need to further reduce eutrophication effects in the Greater North Sea, see: Condition of Benthic Habitat Communities: Assessment of some Coastal Habitats in Relation to Nutrient and/or Organic Enrichment . As a result of management measures, nutrient loads from river discharge into the Greater North Sea have been reduced considerably since 1988, when the OSPAR Contracting Parties agreed to limit inorganic nitrogen and phosphorus inputs to 50% of 1985 levels (Desmit et al., 2020). Reduction objectives have mostly been achieved for phosphorus, but nitrogen has been more difficult to mitigate (McQuatters-Gollop et al., 2007; Riemann et al., 2016). The greater success in mitigating phosphorus may, however, lead to changes in phytoplankton community structure (see: Eutrophication Thematic Assessment , Input of Nutrients to the OSPAR Maritime Area ).
Surface warming and a reduction in nutrient inputs from rivers have contributed to declining primary production and phytoplankton biomass across the North Sea (Capuzzo et al., 2018; Desmit et al. 2020). These reductions have primarily occurred within variable salinity and coastal pelagic habitats and may be associated with changes in the abundance of micro-phytoplankton, including diatoms and dinoflagellates (Spilling et al., 2018; Xiao et al., 2018). Declines in the abundance of diatoms and dinoflagellates have co-occurred with increases in the proportion of biomass from the pico- and nano-phytoplankton size fractions in the western English Channel (Schmidt et al., 2020). A major contributor to this shift is the cyanobacterium Synechococcus, which flourishes under low-nutrient conditions during summer stratification (Schmidt et al. 2020). However, its small size and low nutrient content make it a poor primary producer unlikely to sustain shelf food webs and may lead to community changes in the upper food web levels.
Nutrient inputs to the North Sea have been reduced as a result of efforts to mitigate eutrophication. While this has been an important step towards combating eutrophication in variable salinity and coastal pelagic habitats, it is also likely to limit the productivity of the system (Skogen et al., 2004). The results of the indicator assessments for the Greater North Sea suggest that these reductions, more so for phosphate than for nitrate (reduction of 70% for phosphate and 50% for nitrate; van Beusekom et al., 2009), may have generated an imbalance between two essential nutrients for phytoplankton production by effectively increasing the ratio of nitrogen to phosphorus. This imbalance may have impacted phytoplankton communities, as indicator assessment results revealed the nitrogen to phosphorus ratio (N/P ratio) as the most important pressure associated with the reduction in phytoplankton biomass (PH2) (see: Changes in Phytoplankton Biomass and Zooplankton Abundance , Input of Nutrients to the OSPAR Maritime Area ). These changes have altered the structure of phytoplankton communities, resulting in a general pattern of increase in the abundance of dinoflagellates relative to diatoms (PH1/FW5, Changes in Phytoplankton and Zooplankton Communities ).
The Greater North Sea has also experienced a much faster temperature increase than the North-East Atlantic due to its shallow bathymetry (mean depth 95 m), particularly along its southern coast. In southern areas of the Greater North Sea, warming has led to nutrient limitation from increased stratification, driving a decline in diatom abundance (Edwards et al., 2022). In more northern areas of the North Sea which exhibit less nutrient limitation because of their origin in Atlantic waters, warming has elevated metabolic rates, leading to greater diatom biomass in the spring bloom (Edwards et al., 2022). Continued warming is driving poleward range shifts in copepods (Defriez et al., 2016) at alarmingly fast rates (Beaugrand et al., 2009). There is also evidence that meroplankton, the larvae of benthic organisms (Figure S.6), and particularly echinoderms, molluscs and arthropods, have responded positively to the increase in temperature (Kirby et al., 2008) despite a declining trend in primary production (Capuzzo et al., 2018). Elevated water temperatures may facilitate increases in meroplankton abundance by increasing the reproductive output of some benthic invertebrates, particularly the sea urchin Echinocardium cordatum (Kirby et al., 2007). Increased temperatures may similarly improve the survival of egg and larval stages for small-bodied fish (Rijnsdorp et al., 2009).
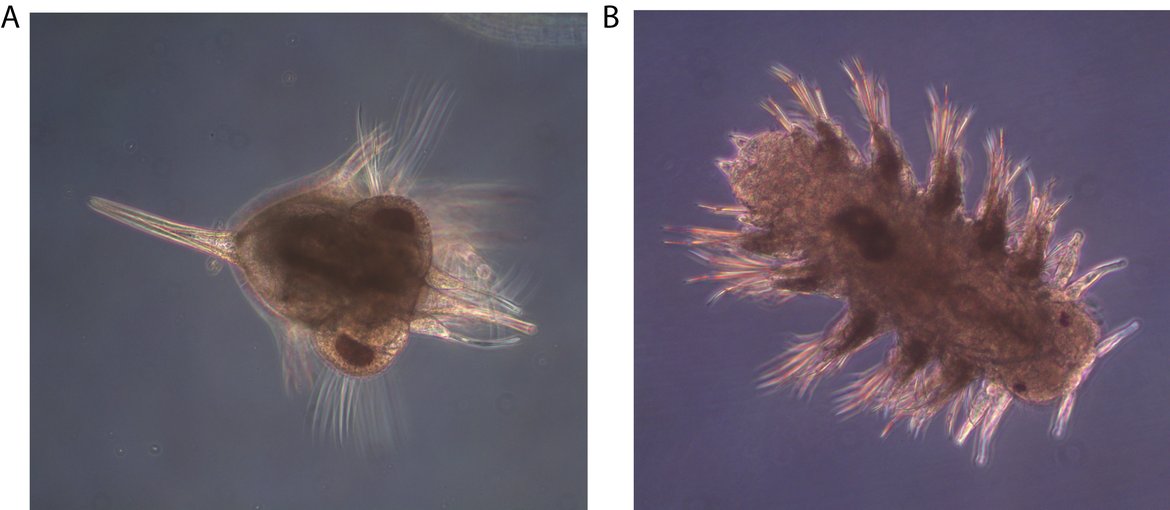
Figure S.6: Meroplankton are increasing in abundance in the Greater North Sea. Meroplankton are the planktonic larvae of benthic invertebrates, and changes in their abundance can reveal information about connectivity between the benthic and pelagic environment. Meroplankton are a taxonomically diverse group which includes decapod crustaceans, such as Cancer pagurus (A), polychaete worms, such as Nereis spp. (B), molluscs, cirripedes, echinoderms, bryozoans, among several others. Image credits: Tanja Burgmer (A, B)
The indicator assessments PH1/FW5 Changes in Phytoplankton and Zooplankton Communities , PH2 Changes in Phytoplankton Biomass and Zooplankton Abundance and PH3 Changes in Plankton Diversity also concluded that climate change has impacted benthic-pelagic coupling in coastal and shelf areas over the past 60 years, with rising sea surface temperatures concomitant with increasing trends in the abundance of meroplankton, likely by driving increased reproduction and recruitment. Conversely, holoplankton, which spend their entire lifecycle as plankton, displayed decreasing abundance trends over the same period. A shallowing mixed layer, typically driven by sustained warming and stable atmospheric conditions, also co-occurred with decreasing trends in zooplankton abundance (PH2; Changes in Phytoplankton Biomass and Zooplankton Abundance). This shallowing mixed layer concentrates productivity within a smaller water volume, thus limiting the flux of nutrients, and imposing further limitations on productivity.
Pelagic habitats in the Celtic Seas (Region III)
In Region III, the status for variable salinity habitats was unknown since this was the status for both PH1/FW5 Changes in Phytoplankton and Zooplankton Communities and PH2 Changes in Phytoplankton Biomass and Zooplankton Abundance indicators, while the PH3 Changes in Plankton Diversity indicator was not assessed (Table S.9). Due to all three pelagic habitat indicators detecting a trend associated with human activity in coastal habitats, the status for coastal habitats was classified as not good environmental status. The shelf habitats result identified a trend associated with human activity for both PH1/FW5 and PH2 indicators (unknown for PH3) which resulted in the status of shelf habitats being classified as not good. Considering that coastal and shelf habitats had not good environmental status while only variable salinity habitats had unknown status (Table S.9), the status for pelagic habitats in the Celtic Seas (Region III) is not good. The integration of confidence scores for common indicators in the Celtic Seas resulted in an overall score of High for this OSPAR Region (Table S.10).
Table S.9: The status for each common and candidate indicator within each pelagic habitat type for the Celtic Seas (OSPAR Region III), derived from the integration of results for each indicator
| Region | Habitat | PH1/FW5 | PH2 | PH3 | Habitat Status | Region Status |
|---|---|---|---|---|---|---|
| Celtic Seas (Region III) | Variable salinity | Unknown | Unknown | Not assessed | Unknown | Not good |
| Coastal | Detected trend linked to human activity | Detected trend linked to human activity | Detected trend linked to human activity | Not good | ||
| Shelf | Detected trend linked to human activity | Detected trend linked to human activity | Unknown | Not good | ||
| Oceanic | Not assessed | Not assessed | Not assessed | Not assessed |
Table S.10: Confidence assessment of the type, amount, quality, and consistency of evidence (i.e. Robust, Medium, or Limited), as well as the degree of agreement in the results (i.e. High, Medium, or Low), for the pelagic habitat indicators assessed in the Celtic Seas (OSPAR Region III). Colours are used for interpretation
| Region | Criteria | PH1/FW5 | PH2 | PH3 | Criteria Status | Region Status |
|---|---|---|---|---|---|---|
| Celtic Seas (Region III) | Agreement | High | High | High | High | High |
| Evidence | Medium | Medium | Medium | Medium |
The Celtic Seas differ from the adjacent Greater North Sea in that they are more strongly influenced by conditions in the Atlantic Ocean, particularly along the edge of the continental shelf. This region is also characterised by more complex bathymetry, including slope, canyons, ridges, and seamounts, which generate local and regional influences on hydrography (ICES, 2021). Within shallower shelf waters, sea surface temperatures are rising, driving an increase in summer stratification and nutrient limitation (ICES, 2021).
Long-term declines in dinoflagellate abundance have been observed in offshore areas (Hinder et al., 2012) and show strong negative correlation with the rising trend in sea surface temperature (Bedford et al., 2020). Conversely, within more coastal and inshore waters, increases in dinoflagellate abundance have been detected, which may have implications for the frequency and severity of harmful algal blooms (HABs), impacting pelagic and benthic communities as well as aquaculture (Bresnan et al., 2021). Eutrophication in the Celtic Seas typically occurs only within inlets, estuaries and other semi-enclosed areas of freshwater influence.
The abundance of holoplankton in the Celtic Seas has declined over the past 60 years, with the net trend primarily driven by a 50% reduction in small copepod abundance during summer (Bedford et al., 2020). The decline in copepods is probably driven by the earlier occurrence of the spring phytoplankton bloom (Atkinson et al., 2015) and the increasing contribution of picophytoplankton to overall phytoplankton abundance (Schmidt et al., 2020), a size fraction which is too small for most microzooplankton to eat. Northward range shifts in cold-water zooplankton assemblages have also occurred over recent decades (Beaugrand et al., 2002; Harris et al., 2015), driving declining abundance trends in cold-water species throughout the Celtic Seas. Such range shifts have driven a change in the dominant Calanus copepod taxa, with the cold-water C. finmarchicus being mostly replaced by the warm-water C. helgolandicus (Beaugrand, 2003) (Figure S.7).
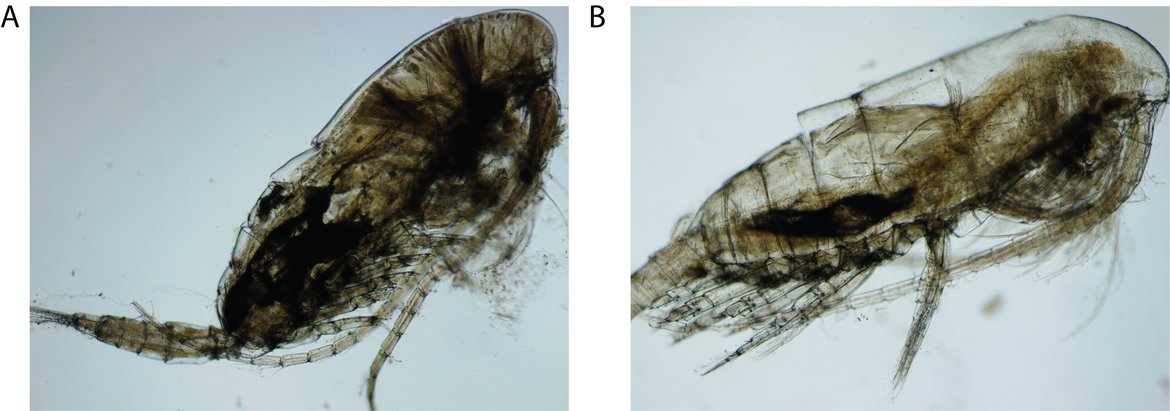
Figure S.7: In the Celtic Seas and Greater North Sea, the temperate copepod Calanus helgolandicus (A) is quickly becoming the dominant species, while the boreal copepod, Calanus finmarchicus (B) has shifted its range further north due to climate change. These two species are functionally similar, despite their differences in thermal range. Image credits: Hannah Lloyd-Hartley (A, B)
Phytoplankton biomass has declined across pelagic habitats over the last two decades, as revealed by in situ and satellite data (Gohin et al., 2019). Recent studies have linked these declines in biomass to surface warming and phosphorus limitation driven by variation in natural climatic cycles (Gohin et al., 2019; Romero et al., 2013). Over the five-year assessment period for the QSR, the PH2 indicator, Changes in Phytoplankton Biomass and Zooplankton Abundance , also detected this decline in phytoplankton biomass. Within variable salinity pelagic habitats, the decline in phytoplankton biomass has been attributed to decreasing nitrate input from rivers, due to reductions in river outflow (Gohin et al., 2019).
The results of the indicator assessments for Region III showed that reductions in nutrients, more so for phosphate than for nitrate (Gowen et al., 2008), along with increased stratification due to rising sea surface temperature, may also be contributing to decreasing trends in diatom abundance (Edwards et al., 2022) and in overall phytoplankton biomass (Figure S.8) Winter Nutrient Concentrations in the Greater North Sea, Celtic Seas and Bay of Biscay and Iberian Coast . The PH2 assessment Changes in Phytoplankton Biomass and Zooplankton Abundance noted a decreasing trend in phytoplankton biomass between 2015 and 2019, without drawing any particular conclusions on environmental status. By contrast, the assessment of chlorophyll-a concentration in the Greater North Sea and Celtic Seas (from HASEC; Concentrations of Chlorophyll-a in the Greater North Sea, Celtic Seas and Bay of Biscay and Iberian Coast ) determined that variable salinity and coastal habitats were in moderate, poor, or bad status during this period, since chlorophyll-a concentrations exceeded threshold levels. Discrepancies between the chlorophyll-a concentration in the Greater North Sea and Celtic Seas indicator Concentrations of Chlorophyll-a in the Greater North Sea, Celtic Seas and Bay of Biscay and Iberian Coast and the PH2 assessment Changes in Phytoplankton Biomass and Zooplankton Abundance are probably due to different datasets underlying the assessments Eutrophication Thematic Assessment . Better identification of the synergies and discrepancies between pelagic habitat and food web indicators, as well as their causes, are being further investigated under Task 1.5 of the NEA PANACEA project.
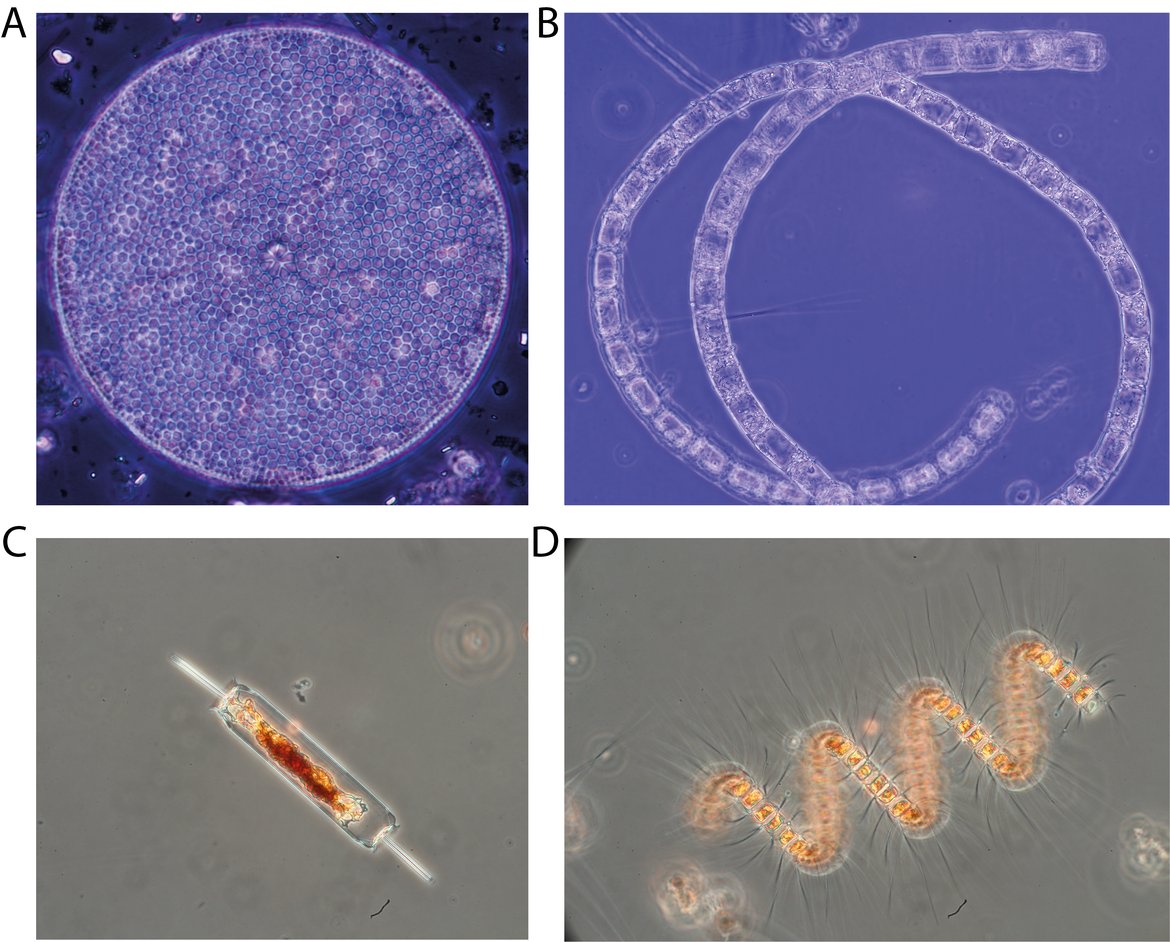
Figure S.8: Diatoms are decreasing in abundance in the Celtic Seas. Diatoms are phytoplankton with silicious cell walls. They are highly abundant and play an essential role in sustaining marine food webs. Common diatoms in the OSPAR Maritime Area include Coscinodiscus radiatus (A), Bellerochea horologicalis (B), Ditylum brightwellii (C) and Chaetoceros debilis (D), among many others. Image credits: Sandra Meier (A, B), Nils Hintz (C, D)
Coastal regions were characterised by contrasting trends, particularly for zooplankton, with decreasing trends in the abundance of several phytoplankton and zooplankton lifeforms Changes in Phytoplankton and Zooplankton Communities , while zooplankton abundance anomalies showed a net increasing trend. These contrasting trends, as well as changes in phytoplankton and zooplankton community composition from pre-2015 conditions, were statistically linked to rising sea surface temperature, accelerated by the warming phase of a natural climatic cycle (i.e., Atlantic Multidecadal Oscillation). With the current analysis method it was not possible to disentangle the separate influences of these two effects.
The contrasting increase in zooplankton abundance despite the decline in phytoplankton biomass suggests that phytoplankton are not currently exerting bottom-up control on zooplankton production, or that phytoplankton abundance is currently excessive; bottom-up control on zooplankton may become more important if phytoplankton biomass continues to decline. Larval fish can also exert top-down control on zooplankton by contributing to their mortality (Ji et al., 2013)., However, the PH1/FW5 indicator Changes in Phytoplankton and Zooplankton Communities detected no trend in larval fish abundance in the Celtic Seas. It is likely that larval fish are also currently at levels below those required to become a limiting influence on zooplankton abundance.
Reductions in pH may have also been a factor within coastal and shelf habitats; however, it is important to note that this inference was based solely on modelled data. This result should be interpreted with caution, as the effects of pH are often obscured by the combined effects of other climatic, chemical, and biotic drivers (Beare et al., 2013). Changes in pH can be linked to changes in primary production, since phytoplankton ingest Dissolved Inorganic Carbon (DIC) to fuel growth and reproduction, but also to the concentration of atmospheric carbon dioxide, the main driver of global warming. Further investigation, taking advantage of in situ pH measurements from long-term monitoring programmes, will help improve scientific understanding about the impacts of decreasing pH on the plankton community.
Pelagic habitats in the Bay of Biscay and Iberian coast (Region IV)
No determination could be made for variable salinity habitats in Region IV since they were not assessed by the PH1/FW5 and PH2 indicators (Table S.11). Due to the coastal habitats assessed as having a trend linked with human activities in PH2, while PH1/FW5 was unknown, the status for coastal habitats was also classified as not good. Both shelf and oceanic / beyond shelf habitats detected trends linked to human activities for PH1/FW5 and PH2, and therefore the status for shelf and oceanic / beyond shelf habitats was not good. Considering that coastal, shelf, and oceanic / beyond shelf habitats were all in not good environmental status (Table S.11), the status for pelagic habitats in the Bay of Biscay and Iberian Coast (Region IV) was also not good. The integration of confidence scores for common indicators in the Bay of Biscay and Iberian Coast resulted in an overall score of Medium for this OSPAR Region (Table S.12) (see: CEMP Guideline for Pelagic Habitats Thematic Assessment Integration Method).
Table S.11: The status of each Common and Candidate indicator within each pelagic habitat type for the Bay of Biscay and Iberian Coast (OSPAR Region IV), derived from the integration of results for each indicator. Diagonally hatched cells indicate that an indicator has candidate status in the region and that a pilot assessment has been produced. PH3 results have been presented for information purposes only
| Region | Habitat | PH1/FW5 | PH2 | PH3 | Habitat Status | Region Status |
|---|---|---|---|---|---|---|
| Bay of Biscay and Iberian Coast (Region IV) | Variable salinity | Not assessed | Not assessed | Not assessed | Not assessed | Not good |
| Coastal | Unknown | Detected trend linked to human activity | Not good | Not good | ||
| Shelf | Detected trend linked to human activity | Detected trend linked to human activity | Unknown | Not good | ||
| Oceanic | Detected trend linked to human activity | Detected trend linked to human activity | Unknown | Not good |
A pilot assessment of the PH3 indicator was also produced for the Bay of Biscay and Iberian Coast (OSPAR Region IV). However, since the PH3 indicator is only a candidate indicator in the present Region, the results are not described in detail below. For further information, please consult the PH3 indicator assessment.
Table S.12: Confidence assessment of the type, amount, quality, and consistency of evidence (i.e., Robust, Medium, or Limited) as well as the degree of agreement in the results (i.e. High, Medium, or Low) for the pelagic habitat indicators assessed in the Bay of Biscay and Iberian Coast (OSPAR Region IV). Colours are used for interpretation. Diagonally hatched cells indicate that an indicator has candidate status in the Region and that, while a pilot assessment has been conducted, a confidence assessment has not been produced
| Region | Criteria | PH1/FW5 | PH2 | PH3 | Criteria Status | Region Status |
|---|---|---|---|---|---|---|
| Bay of Biscay and Iberian Coast (Region IV) | Agreement | High | High | Not assessed | High | Medium |
| Evidence | Limited | Limited | Not assessed | Limited |
The Bay of Biscay and Iberian Coast are characterised by marked seasonal mixing and stratification dynamics typical of temperate seas. Productivity in this Region is driven by wind-driven upwelling, river outflow and tidal processes, making this pelagic ecosystem particularly productive, with large variations in productivity at smaller scales (ICES, 2021). The Bay of Biscay and Iberian Coast Region has experienced several important changes in recent decades. Climate change has influenced pelagic habitats throughout this Region, with the strongest warming occurring over the past two decades, particularly within the Gulf of Cadiz (ICES, 2021). Surface warming has been responsible for driving decreasing trends in zooplankton abundance and community-wide changes, with cold-water species being replaced by warm-water species as their distributions shift northward (Bode et al., 2009). Strong surface warming has also intensified stratification in recent years, countering the influence of increasing local wind speed on upwelling intensity (Sousa et al., 2020). In contrast, estuarine sites along the Iberian coast have experienced decreasing trends in wind speed over the past 60 years, with current trends predicted to continue until at least 2100 (Álvarez Salgado et al., 2008).
Eutrophication is an important pressure in the Bay of Biscay, particularly within variable salinity and coastal pelagic habitats. However, in contrast to the decrease in inorganic nitrate and phosphorus achieved through management measures in other OSPAR Regions, nitrate concentrations have remained relatively stable in the Bay of Biscay. During the period between 2012 and 2016, both nitrogen and phosphorus remained above threshold levels, and GES was not achieved for Criterion 1 under Descriptor 5 of the EU MSFD (Nutrients in the Water Column) (Lefebvre and Devreker, 2020) (OSPAR acts as a coordination platform in the North-East Atlantic for the regional implementation of the EU Marine Strategy Framework Directive (MSFD) that aims to achieve a Good Environmental Status (GES) in European marine environments, as well as for the coordination of other national frameworks. The characteristics of GES are determined by the individual EU member states, based on criteria elements, threshold values and methodological standards set regionally or at EU level. Norwegian, Icelandic, United Kingdom, Greenlandic and Faroese marine areas are not covered by the MSFD.) (See: Winter Nutrient Concentrations in the Greater North Sea, Celtic Seas and Bay of Biscay and Iberian Coast ).
To support QSR 2023, the Bay of Biscay and Iberian Coast (OSPAR Region IV) was sub-divided into assessment units enabling the pelagic habitat indicators to be resolved at beyond the regional scale. However, because this OSPAR Region extends beyond the boundaries of the hydrological model used to define the COMP4 assessment units for the Greater North Sea and the Celtic Seas (OSPAR Regions II and III respectively; DCSMv6 FM), it was necessary to adapt a separate methodology to define assessment units within it. Although the procedure for sub-dividing the Bay of Biscay and Iberian Coast (OSPAR Region IV) has been validated by OSPAR (see: COMP4 annexes), for the purposes of this and other eutrophication and food web assessments it needs to be reviewed in order to better represent the oceanography and plankton dynamics of the Region and to ensure greater consistency and accuracy in the conclusions of subsequent OSPAR assessments.
In agreement with the results of the PH2 indicator for coastal habitats, natural climatic variability (i.e., the North Atlantic Oscillation) and surface warming have been extensively reported as factors influencing the variability of phytoplankton biomass (Bode et al., 2013). The declines in biomass detected by the PH2 indicator were supported by the PH1/FW5 indicator, which revealed a significant increase in the abundance of dinoflagellates, while diatom abundance remained stable (Edwards et al., 2022). In agreement with the increasing trend in copepod abundance detected by the PH2 indicator, Bode et al. (2013) also reported increasing trends in copepod abundance at coastal stations, except for the north-west coast of Spain, where copepod abundance has declined due to surface warming (Bode et al., 2020).
Long-term studies have explored the complex dynamics of coastal plankton communities in this region (Bode et al., 2020; Buttay et al., 2016). While the PH1/FW5 indicator revealed declining abundance trends for most planktonic lifeforms (e.g., small copepods, large copepods and holoplankton), meroplankton abundance increased (Bode et al., 2020). Similar important shifts in the plankton community have been observed over the past twenty years off the coast of Galicia. Bode et al. (2020) identified the year 1998 as marking a shift in the relative abundance of meroplankton versus holoplankton, with the former becoming more dominant during a period of wet conditions and surface warming. The year 2002 marked a second shift, with increasing microzooplankton abundance associated with changes to local oceanographic conditions (Bode et al., 2020). However, these results should be interpreted with caution, since there was high variability in long-term trends at site scale (Richirt et al., 2019).
The indicator assessment results (see: PH1/FW5 Changes in Phytoplankton and Zooplankton Communities and PH2 Changes in Phytoplankton Biomass and Zooplankton Abundance ) showed that rising sea surface temperature was statistically linked to decreasing trends in small and large copepods and to total zooplankton abundance within shelf and oceanic pelagic habitats. Within these offshore areas nearly all planktonic lifeforms have experienced decreasing long-term abundance trends, indicating a reduction in the energy available to sustain higher trophic levels. Unfortunately, no data were available to evaluate any indicators within variable salinity habitats. Similarly, there were no suitable data available to evaluate change in zooplankton lifeforms within coastal habitats.
Pelagic habitats in the Wider Atlantic (Region V)
The region-specific summary for the Wider Atlantic (OSPAR Region V) has been entirely based on the scientific literature, since no indicator assessments were conducted in this Region.
The bathymetry of Region V consists primarily of abyssal plain, interrupted by the dominant Mid-Atlantic Ridge. It is also characterised by the presence of seamounts, of which 143 are scattered within its boundaries (91% of all seamounts occurring within the OSPAR Maritime Area) (Harris et al., 2014). While upwelling around seamounts is often hypothesised to generate areas of high phytoplankton and zooplankton productivity, studies within Region V have not found this to be the case (Kutti et al., 2019). Seamounts do, however, act as aggregation sites for demersal and pelagic fish stocks and are thus heavily targeted by high seas fisheries (Kutti et al., 2019). This high concentration of fishing pressure around seamounts may impact pelagic food webs (Clark et al., 2010).
In the Wider Atlantic, the North Atlantic Current (NAC) is the dominant influence on pelagic habitats and generates the Subpolar Front, which sharply delineates Atlantic waters from the much colder Arctic waters to the north (Belkin and Levitus, 1996). Seasonal variations in Region V are generally of much lower magnitude than in Arctic Waters. This stability is driven by the difference in latitude coupled with strong bathymetric steering, generating spatially stable hydrodynamic regimes of high mesoscale turbulence in the central North Atlantic (Rossby, 1996). This turbulence generates high mixing, which fuels phytoplankton productivity. The phytoplankton in this region are eaten by herbivorous zooplankton, particularly Calanoid copepods, together with Oithona and Oncaea spp., which dominate zooplankton abundance (Woodd-Walker et al., 2002). The high spatial stability of productive conditions in the central North Atlantic allows the region to support high numbers of mesopelagic fish, seabirds and higher predators (Davies et al., 2021).
This is the most isolated OSPAR Region, with the Azores constituting the only major landmass within its boundaries and most of its area consisting of international waters. As a result of its isolation, there have been very few recent studies focusing specifically on changes in the state of pelagic habitats within this Region. Regular monitoring programmes are scarce and most studies within this Region rely solely on Continuous Plankton Recorder (CPR) or satellite data. Recent investigations of the phytoplankton community from long-term time-series (1958 to 2017) have demonstrated a trend, linked to climate warming, of increasing diatom abundance in northerly waters, and a decline in diatom abundance in southerly waters in the North-East Atlantic (Edwards et al., 2022). The abundance of euphausiids (i.e., krill) in this Region has also experienced a decreasing trajectory over the past 60 years coincident with latitudinal constriction of their optimal thermal range (Edwards et al., 2021).
Habitat-specific summary
In the description of habitat-specific results below, the linkage between indicators and pressures refers to the pressure which best predicts each indicator component, while other pressures may have an important but less statistically significant contribution to the observed changes in pelagic habitats. Relationships with other pressures are not reported here, although they are described in the relevant indicator assessments: PH1/FW5 Changes in Phytoplankton and Zooplankton Communities , PH2 Changes in Phytoplankton Biomass and Zooplankton Abundance , PH3 Changes in Plankton Diversity .
Pelagic habitats in the Greater North Sea (Region II)
Table S.13: The status of each Common and Candidate indicator within each pelagic habitat type for the Greater North Sea (OSPAR Region II), derived from the integration of the results for each indicator. Diagonally hatched cells indicate that an indicator has candidate status in the region and that a pilot assessment has been produced. PH3 results have been presented for information purposes only
| Region | Habitat | PH1/FW5 | PH2 | PH3 - Pilot Assessment |
|---|---|---|---|---|
| Greater North Sea (Region II) | Variable salinity | Unknown | Unknown | Not good |
| Coastal | Unknown | Detected trend linked to human activity | Not good | |
| Shelf | Detected trend linked to human activity | Detected trend linked to human activity | Unknown | |
| Oceanic | Not assessed | Not assessed | Not assessed |
A pilot assessment of the PH3 indicator was also produced for the Greater North Sea (Region II). However, since the PH3 indicator is only a candidate indicator in the present region, the results are not described in detail below. For further information, please consult the PH3 indicator.
Variable salinity habitats
For variable salinity habitats, PH1/FW5 indicated that dinoflagellates and larval fish have been increasing in abundance, based on long-term trends. Holoplankton, large copepods and small copepods indicate significant decreasing trends. Plankton monitoring datasets were only available for a limited number of assessment units, although with significant gaps in the time-series. Therefore, lower confidence must be assigned to these results, particularly for the zooplankton lifeform time-series. No clear links between changes in lifeform abundance and anthropogenic pressures could be made.
For the PH2 indicator, a strong decreasing trend in phytoplankton biomass was observed. Modelling of the linkage between environmental pressures and phytoplankton biomass attributed this change to decreasing concentrations of dissolved inorganic phosphate. The PH2 indicator also detected a significant downward trend in zooplankton abundance which was linked statistically to the rise in sea surface temperature. It is also likely that the downward trend in phytoplankton biomass influenced the downward trend in zooplankton abundance; however, the PH2 indicator does not currently test phytoplankton biomass as a pressure on zooplankton. Further, the assessment of zooplankton abundance was based on a single assessment unit; there was very low spatial representation of assessment units and a high degree of uncertainty in establishing the status for this pelagic habitat type.
Coastal habitats
For coastal habitats, the PH1/FW5 indicator revealed significant upward trends in meroplankton and larval fish abundance, which may have been associated with the rise in sea surface temperatures and increasing salinity, respectively. The confidence assessment for the indicator revealed generally high spatial and temporal confidence among the time-series considered in the assessment, and high spatial representation of assessment units, except for gelatinous zooplankton. However, there was a high degree of variability in associating trends in lifeform abundance with environmental pressures; thus, the associations with sea surface temperature and salinity lacked confidence.
The PH2 indicator revealed a significant downward trend in phytoplankton biomass. The most important predictor in declining phytoplankton biomass was the increase in the ratio of nitrogen to phosphorus (N/P ratio). This upward trend in the N/P ratio has been a consequence of efforts to combat eutrophication, with greater reductions achieved for phosphorus loading than for nitrogen. Zooplankton abundance indicated a significant upward trend linked to a shallowing of the mixed layer. The contrasting increase in zooplankton abundance despite the decline in phytoplankton biomass suggests that phytoplankton are not currently exerting bottom-up control on zooplankton production; bottom-up control on zooplankton may become more important if phytoplankton biomass continues to decline. However, as stated previously, the PH2 indicator does not currently test phytoplankton biomass as a pressure on zooplankton and further investigation should be carried out.
Shelf habitats
For shelf habitats, the PH1/FW5 indicator revealed that diatoms, meroplankton, and larval fish have undergone significant upward long-term trends, while dinoflagellates, holoplankton, and small copepods experienced significant downward trends. For meroplankton and holoplankton, the abundance trends were associated with rising sea surface temperature with a high degree of spatial consistency. The increase in larval fish abundance was statistically linked to changes in light attenuation. It is likely that larval fish abundance also correlated with spawning stock biomass and reproductive output; however, the PH1/FW5 indicator does not test for this. While no data were available to assess trends for gelatinous zooplankton, the confidence assessment for the indicator revealed generally high spatial and temporal confidence among the time-series considered in the assessment, and high spatial representation of assessment units.
Similar to the patterns observed in coastal habitats, the PH2 indicator also revealed a significant downward trend in phytoplankton biomass, linked to an increase in the ratio of nitrogen to phosphorus (N/P ratio) due to a more successful effort to mitigate phosphorus versus nitrogen. Zooplankton abundance exhibited a significant downward trend linked to the shallowing mixed layer depth. It is also likely that the downward trend in phytoplankton biomass influenced the downward trend in zooplankton abundance; however, the PH2 indicator does not currently test phytoplankton biomass as a pressure on zooplankton.
Oceanic / beyond shelf habitats
While the Greater North Sea (Region II) intersects a small portion of an oceanic / beyond shelf assessment unit (Figure S.3), this habitat type was not assessed, since it shares far greater overlap with the Bay of Biscay and Iberian Coast (Region IV).
Pelagic habitats in the Celtic Seas (Region III)
Table S.14: The status of each Common and Candidate indicator within each pelagic habitat type for the Celtic Seas (OSPAR Region III), derived from the integration of results for each indicator
| Region | Habitat | PH1/FW5 | PH2 | PH3 |
|---|---|---|---|---|
| Celtic Seas (Region III) | Variable salinity | Unknown | Unknown | Not assessed |
| Coastal | Detected trend linked to human activity | Detected trend linked to human activity | Detected trend linked to human activity | |
| Shelf | Detected trend linked to human activity | Detected trend linked to human activity | Unknown | |
| Oceanic | Not assessed | Not assessed | Not assessed |
Variable salinity habitats
For variable salinity habitats, the PH1/FW5 indicator revealed that dinoflagellates have experienced significant upward long-term trends, while all other planktonic lifeforms have undergone significant downward trends. However, there was very low representation of assessment units for all zooplankton lifeforms. For diatoms, trends indicating decreasing abundance were linked to an increase in the ratio of nitrogen to phosphorus. While silicate may have also been an important factor, there were no suitable data available to test this. For large copepods, which were only assessed at a single fixed-point monitoring station, the decreasing trend was linked to a rise in sea surface temperature.
The PH2 indicator detected a significant decline in zooplankton abundance, linked to a decrease in surface current velocity. However, it is probable that changes in water current dynamics were also linked to the rise in water temperature (van der Molen and Pätsch, 2022). PH2 also detected a significantly decreasing trend in phytoplankton biomass, which was linked to a decrease in the concentration of both nitrogen and phosphorus.
Due to a combination of limited data availability within variable salinity habitats and the methodological limitations associated with spatial and temporal interpolation of diversity, the PH3 indicator was not assessed in this habitat.
Coastal habitats
For coastal habitats, the PH1/FW5 indicator showed that dinoflagellates, holoplankton, large copepods, and small copepods all underwent significant downward trends linked to rising sea surface temperature, and, for holoplankton, to pH. No data were available for gelatinous zooplankton. There was high confidence for all time-series assessed and high spatial representation of assessment units.
The pH level of seawater is controlled by the concentration of dissolved inorganic carbon (DIC). Changes in pH can be linked to changes in phytoplankton activity, since phytoplankton ingest DIC to fuel growth and reproduction, but also to the concentration of atmospheric carbon dioxide, the main driver of global warming. The OSPAR Ocean Acidification Other Assessment measured a significant decrease in pH at a rate of -0,0019 yr-1 within OSPAR Region III. This decreasing trend in pH was strongly linked with the decreasing trend in phytoplankton biomass detected by the PH2 indicator. However, for reasons described above, the relationship between pH and phytoplankton biomass should be evaluated cautiously and further analysis is necessary to quantify phytoplankton’s contribution to pH variability. This general statement also applies to the other OSPAR Regions. The second plankton component of the PH2 indicator, zooplankton abundance, demonstrated a significant upward trend linked to an increase in the Atlantic Multidecadal Oscillation (AMO), which corresponds with the warming phase of natural climate variability in the North Atlantic. The contrasting increase in zooplankton abundance despite the decline in phytoplankton biomass suggests that phytoplankton are not currently exerting bottom-up control on zooplankton production; bottom-up control on zooplankton may become more important if phytoplankton biomass continues to decline.
While trends in holoplankton abundance detected by the PH1/FW5 indicator and trends in phytoplankton biomass revealed by PH2 were statistically significant, long-term trends in plankton community diversity (PH3) were not. Despite this lack of statistical significance, PH3 results trended towards atypical biodiversity composition, indicating greater instability in the plankton community due to high species turnover and increasing relative abundance of dominant taxa. Zooplankton have also shifted towards an atypical community composition, which may have been linked to changes in salinity. However, these long-term trends in zooplankton community diversity (PH3) were also not statistically significant, leading to the conclusion that there were no long-term changes in phytoplankton and zooplankton community composition.
Shelf habitats
For shelf habitats, the PH1/FW5 indicator revealed significant upward trends for meroplankton and significant downward trends for dinoflagellates and holoplankton. For dinoflagellates, the trend showing decreasing abundance demonstrated the strongest correlation with increase in N/P ratio driven by the reduction in anthropogenic nutrient inputs, more so for phosphate than for nitrate. For meroplankton and holoplankton, changes were linked to increasing sea surface temperature and reductions in pH, respectively. Rising temperatures may increase the reproductive output of benthic invertebrates (Kirby et al., 2007; Kirby et al., 2008) and reductions in pH can affect reproduction in copepods (Vehmaa et al., 2016) and can make them more vulnerable to food limitation (Mayor et al., 2015; Pedersen et al., 2014). The confidence assessment for the PH1/FW5 indicator revealed generally high spatial and temporal confidence among the time-series considered in the assessment, and high spatial representation of assessment units. No data were available to assess gelatinous zooplankton.
Reductions in pH were also associated with the decreasing trajectories detected for both phytoplankton and zooplankton components of the PH2 indicator. It is important to note that pH is not an independent variable. Dissolved Inorganic Carbon (DIC) levels from both natural and anthropogenic sources influence pH levels in sea water. Autotrophic phytoplankton take up DIC during the process of photosynthesis, and the increased primary productivity reduces DIC concentrations and potentially increases pH. From the analysis performed here it is not possible to determine if the net change in phytoplankton biomass is the result of changes in pH. This merits further investigation.
No significant long-term changes in phytoplankton or zooplankton community composition were detected with the PH3 indicator. Despite this lack of statistical significance, PH3 results trended towards lower stability in phytoplankton and greater stability in zooplankton community composition. The decrease in stability was most closely linked with the decrease in the concentration of dissolved inorganic phosphate. By contrast, the increasing stability of the zooplankton community was most closely linked with a decrease in light attenuation. Decreasing dinoflagellate abundance, detected with the PH1/FW5 indicator, and decreasing phytoplankton biomass, detected with PH2, probably contributed to the increasing trend in light penetration, as there have been no recent changes in suspended particulate matter (SPM) within shelf habitats in Region III (see: https://moat.cefas.co.uk/ocean-processes-and-climate/turbidity/ for information on SPM). Before it is possible to generate such conclusions it will be necessary to develop an improved methodology for identifying common themes among the results of the three pelagic habitat indicators.
Oceanic / beyond shelf habitats
While the Celtic Seas (Region III) intersects a small portion of an Oceanic / beyond shelf assessment unit (Figure S.3), this habitat type was not assessed, since it shares far greater overlap with the Bay of Biscay and Iberian Coast (Region IV).
Pelagic habitats in the Bay of Biscay and Iberian coast (Region IV)
Table S.15: The status of each Common and Candidate Indicator within each pelagic habitat type for the Bay of Biscay and Iberian Coast (OSPAR Region IV), derived from the integration of results for each indicator. Diagonally hatched cells indicate that an indicator has candidate status in the region and that a pilot assessment has been produced. PH3 results have been presented for information purposes only
| Region | Habitat | PH1/FW5 | PH2 | PH3 - Pilot Assessment |
|---|---|---|---|---|
| Bay of Biscay and the Iberian Coast (Region IV) | Variable salinity | Not assessed | Not assessed | Not assessed |
| Coastal | Unknown | Detected trend linked to human activity | Not good | |
| Shelf | Detected trend linked to human activity | Detected trend linked to human activity | Unknown | |
| Oceanic | Detected trend linked to human activity | Detected trend linked to human activity | Unknown |
A pilot assessment of the PH3 indicator was also produced for the Bay of Biscay and Iberian Coast (OSPAR Region IV). However, since the PH3 indicator is only a candidate indicator in the present region, the results are not described in detail below. For further information, please consult the PH3 indicator assessment.
Variable salinity habitats
For variable salinity habitats, there were no suitable plankton monitoring data available to evaluate the pelagic habitat indicators.
Coastal habitats
For coastal habitats, only phytoplankton data were available to inform the PH1/FW5 indicator. Further, trends in diatoms and dinoflagellates in this case had to be represented by a dataset which records only specimens from the genera Pseudo-nitzschia and Dinophysis, and thus is not representative of the microphytoplankton community as a whole. While the assessed time-series had moderate confidence, there was poor spatial representation of assessment units, and no clear links could be drawn between changes in lifeform abundance and environmental pressures.
The PH2 indicator revealed a decreasing trend in phytoplankton biomass, associated with the North Atlantic Oscillation (NAO). The NAO is a natural climatic cycle which describes the latitudinal gradient in atmospheric pressure across the North Atlantic. On examining the current literature, it was surprising to observe a significant NAO effect within coastal habitats in the Bay of Biscay, since the effects of the NAO are typically stronger within shelf habitats (e.g., Ferreira et al., 2019). However, pelagic habitat experts who study OSPAR Region IV have stated concerns that the COMP4 assessment units may not fully capture the hydrological and ecological conditions of the Region. For future assessments it will be important to further refine these assessment units to better fit the features and dynamics of distinct pelagic habitats within Region IV. PH2 also revealed an increasing trend in zooplankton abundance, linked to rising sea surface temperature. However, results for zooplankton were obtained from a single fixed-point monitoring station, making spatial confidence limited.
Shelf habitats
For shelf habitats, PH1/FW5 revealed that diatoms, holoplankton, meroplankton, large copepods, and small copepods all showed significant downward trends. No data were available to assess gelatinous zooplankton; however, there was generally high confidence across the assessed time-series and moderate spatial representation of assessment units. Downward trends in holoplankton, large copepods, and small copepods were all linked to rising sea surface temperature.
The PH2 indicator also revealed a significant upwards trend in phytoplankton biomass linked to reduced wind velocity, which generates a more stable surface layer with reduced vertical mixing. This observation is currently supported by several studies in the Region. Off the coast of Galicia and Portugal, phytoplankton biomass tends to increase (Ferreira et al., 2019) as upwelling intensity decreases (Santos et al., 2011). In shelf habitats, patterns of increasing phytoplankton biomass were better explained by variation in climatic conditions and mixed layer depth than by changes in nutrient concentration (Ferreira et al., 2019). In agreement with trends observed in small and large copepods (PH1/FW5 indicator), zooplankton abundance (PH2 indicator) showed a significant downward trend linked to variation in mixed layer depth.
Oceanic / beyond shelf habitats
For oceanic / beyond shelf habitats, the PH1/FW5 indicator demonstrated that meroplankton underwent significant upward trends. All other lifeforms underwent significant downward trends except for gelatinous zooplankton, which were not assessed due to the lack of data. Downward trends in holoplankton, large copepods, and small copepods were all linked to rising sea surface temperature. Despite the low spatial representation of assessment units for informing PH1/FW5, the assessment units considered for this pelagic habitat were spatially extensive and incorporated a very large quantity of samples with wide spatial distribution. This contributed to the high confidence in the time-series used to assess PH1/FW5.
The PH2 indicator revealed a significant downward trend in phytoplankton biomass, correlated with a downward trend in light attenuation (increasing water clarity). However, it is likely that the downward trend in light attenuation was the direct result of the change in phytoplankton biomass. In agreement with PH1/FW5, PH2 also revealed a significant downward trend in zooplankton abundance, linked to increasing sea surface temperature. It is likely that the downward trend in zooplankton abundance was also influenced by the decline in phytoplankton biomass; however, the three indicator assessments currently only consider links to abiotic environmental variables.
Aarflot, J.M., Skjoldal, H.R., Dalpadado, P. and Skern-Mauritzen, M. (2018.) Contribution of Calanus species to the mesozooplankton biomass in the Barents Sea. ICES J. Mar. Sci. 75, 2342–2354.https://doi.org/10.1093/icesjms/fsx221
Álvarez-Salgado, X. A., Labarta, U., Fernández-Reiriz, M. J., Figueiras, F. G., Rosón, G., Piedracoba, S. and Cabanas, J. M. (2008). Renewal time and the impact of harmful algal blooms on the extensive mussel raft culture of the Iberian coastal upwelling system (SW Europe). Harmful Algae, 7(6), 849-855.
Atkinson, A., Harmer, R. A., Widdicombe, C. E., McEvoy, A. J., Smyth, T. J., Cummings, D. G. and McConville, K. (2015). Questioning the role of phenology shifts and trophic mismatching in a planktonic food web. Progress in Oceanography, 137, 498-512.
Beaugrand, G. (2003). Long‐term changes in copepod abundance and diversity in the north‐east Atlantic in relation to fluctuations in the hydroclimatic environment. Fisheries Oceanography, 12(4‐5), 270-283.
Beaugrand, G., Luczak, C. and Edwards, M. (2009). Rapid biogeographical plankton shifts in the North Atlantic Ocean. Global Change Biology 15: 1790-1803.
Beaugrand, G., Reid, P. C., Ibanez, F., Lindley, J. A. and Edwards, M. (2002). Reorganization of North Atlantic marine copepod biodiversity and climate. Science, 296(5573), 1692-1694.
Bedford, J., Ostle, C., Johns, D. G., Atkinson, A., Best, M., Bresnan, E. and McQuatters‐Gollop, A. (2020). Lifeform indicators reveal large‐scale shifts in plankton across the North‐West European shelf. Global Change Biology, 26(6), 3482-3497.
Belkin, I. M. and Levitus, S. (1996). Temporal variability of the subarctic front near the Charlie‐Gibbs Fracture Zone. Journal of Geophysical Research: Oceans 101: 28317-28324.
Bode, A., Álvarez, M., García García, L. M., Louro, M. Á., Nieto-Cid, M., Ruíz-Villarreal, M. and Varela, M. M. (2020). Climate and local hydrography underlie recent regime shifts in plankton communities off Galicia (NW Spain). Oceans, 1(4), 181-197.
Bode, A., Alvarez-Ossorio, M. T., Miranda, A. and Ruiz-Villarreal, M. (2013). Shifts between gelatinous and crustacean plankton in a coastal upwelling region. ICES Journal of Marine Science, 70(5), 934-942.
Bode, A., Álvarez-Ossorio, M., Cabanas, J., Miranda, A. and Varela, M. (2009). Recent trends in plankton and upwelling intensity off Galicia (NW Spain). Progress in Oceanography, 83: 342–350.
Bresnan, E., Arévalo, F., Belin, C., Branco, M. A., Cembella, A. D., Clarke, D. and Enevoldsen, H. (2021). Diversity and regional distribution of harmful algal events along the Atlantic margin of Europe. Harmful Algae, 102, 101976.
Buttay, L., Miranda, A., Casas, G., Gonzalez-Quiros, R. and Nogueira, E. (2016). Long-term and seasonal zooplankton dynamics in the northwest Iberian shelf and its relationship with meteo-climatic and hydrographic variability. Journal of Plankton Research, 38(1), 106-121.
Capuzzo, E., C. P. Lynam, J. Barry, D. Stephens, R. M. Forster, N. Greenwood, A. McQuatters‐Gollop, T. Silva, S. M. van Leeuwen and G. H. Engelhard. (2018). A decline in primary production in the North Sea over 25 years, associated with reductions in zooplankton abundance and fish stock recruitment. Global change biology 24: e352-e364.
Clark, M. R., A. A. Rowden, T. Schlacher, A. Williams, M. Consalvey, K. I. Stocks, A. D. Rogers, T. D. O'Hara, M. White and T. M. Shank. (2010). The ecology of seamounts: structure, function, and human impacts. Ann Rev 2.
Dahlke, S., Hughes, NE., Wagner, PM., Garland, S., Wawrzyniak, T., Ivanov, B. and Maturilli, M. 2020. The observed recent surface air temperature development across Svalbard and concurring footprints on local sea ice cover. Int. J.Climatol. 2020: 1-20.
Dale, T., Bagøien, E., Melle, W. and Kaartvedt, S. (1999). Can predator avoidance explain varying overwintering depth of Calanus in different oceanic water masses? Mar Ecol Prog Ser 179,113- 121.
Dalpadado, P. Arrigo, KR., van Dijken, G.L., Skjoldal, HR., Bagøien, E., Dolgov, AV., Prokopchuk, IP. and Sperfeld, E. (2020). Climate effects on temporal and spatial dynamics of phytoplankton and zooplankton in the Barents Sea. Prog. Oceanofr. 185,1-20.
Davies, T. E., Carneiro, A. P., Tarzia, M., Wakefield, E., Hennicke J. C., Frederiksen, M., Hansen, E. S., Campos, B., Hazin, C. and Lascelles, B. (2021). Multispecies tracking reveals a major seabird hotspot in the North Atlantic. Conservation Letters 14: e12824.
Defriez, E. J., Sheppard, L. W., Reid, P. C. and Reuman, D. C. (2016). Climate change‐related regime shifts have altered spatial synchrony of plankton dynamics in the North Sea. Global Change Biology 22: 2069-2080.
Desmit, X., Nohe, A. =, Borges, A. V., Prins, T., De Cauwer, K., Lagring, R., Van der Zande, D. and Sabbe, K. (2020). Changes in chlorophyll concentration and phenology in the North Sea in relation to de‐eutrophication and sea surface warming. Limnology and Oceanography 65: 828-847.
Edwards, M., Beaugrand, G., Kléparski, L., Hélaouët, P. and Reid, P. C. (2022). Climate variability and multi-decadal diatom abundance in the Northeast Atlantic. Communications Earth & Environment, 3(1), 1-8.
Edwards, M., Hélaouët, P., Goberville, E., Lindley, A., Tarling, G. A., Burrows, M. T. and Atkinson, A.. (2021). North Atlantic warming over six decades drives decreases in krill abundance with no associated range shift. Communications biology 4:644.
Eriksen, E., Skjoldal, H.R., Dolgov, A.V., Dalpadado, P., Orlova, EL. and Prozorkevich, D.V. (2016). The Barents Sea euphausiids: methodological aspects of monitoring and estimation of abundance and biomass. ICES Journal of Marine Science, 73:1533–1544.
Eriksen, E., Skjoldal, HR., Gjøsæter, H. and Primicerio, R. (2017). Spatial and temporal changes in the Barents Sea pelagic compartment during the recent warming. Progress in Oceanography 151, 206-226.
Ferreira, A., Garrido-Amador, P. and Brito, A. C. (2019). Disentangling environmental drivers of phytoplankton biomass off western Iberia. Frontiers in Marine Science, 6, 44.
Gohin, F., Van der Zande, D., Tilstone, G., Eleveld, M. A., Lefebvre, A., Andrieux-Loyer, F. and Saulquin, B. (2019). Twenty years of satellite and in situ observations of surface chlorophyll-a from the northern Bay of Biscay to the eastern English Channel. Is the water quality improving? Remote Sensing of Environment, 233, 111343.
Gowen, R. J., Tett, P., Kennington, K., Mills, D. K., Shammon, T. M., Stewart, B. M. and Wither, A. (2008). The Irish Sea: is it eutrophic? Estuarine, Coastal and Shelf Science, 76(2), 239-254.
Harris, P., M. Macmillan-Lawler, J. Rupp and E. Baker. (2014). Geomorphology of the oceans. Marine Geology 352: 4-24.
Harris, V., Olhede, S. C. and Edwards, M. (2015). Multidecadal spatial reorganisation of plankton communities in the North East Atlantic. Journal of Marine Systems, 142, 16-24.
Hinder, S. L., Hays, G. C., Edwards, M., Roberts, E. C., Walne, A. W. and Gravenor, M. B. (2012). Changes in marine dinoflagellate and diatom abundance under climate change. Nature Climate Change, 2(4), 271-275.
ICES 2021. Celtic Seas ecoregion – Ecosystem Overview. ICES Advice: Ecosystem Overviews. Report.
ICES 2020 a. Working Group on the Integrated Assessments of the Norwegian Sea (WGINOR; outputs from 2019meeting). ICES Scientific Reports. 2:29. 46 s. http://doi.org/10.17895/ices.pub. 5996
ICES 2020 b. Report of the Working Group on Integrated Assessments of the Barents Sea (WGIBAR).
ICES. 2021. Bay of Biscay and the Iberian Coast ecoregion – Ecosystem overview. In Report of the ICES Advisory Committee, 2021. ICES Advice 2021.
IPCC, 2019: IPCC Special Report on the Ocean and Cryosphere in a Changing Climate [H.-O. Pörtner,D.C. Kvingedal, B. (2005). Sea-Ice Extent and Variability in the Nordic Seas, 1967-2002. I: Drange, H., Dokken,T., Furevik, T., Gerdes, R. and Berger, W. (Red.) b. 158 The Nordic Seas: An Integrated Perspective, Oceanography, Climatology, Biogeochemistry, and Modelling, s. 39-50, American Geophysical Union, Washington DC, USA.
Ji, R., Stegert, C. and Davis, C. S. (2013). Sensitivity of copepod populations to bottom-up and top-down forcing: a modelling study in the Gulf of Maine region. Journal of Plankton Research, 35(1), 66-79.
Kirby, R. R., Beaugrand, G. and Lindley, J. A. (2008). Climate‐induced effects on the meroplankton and the benthic‐pelagic ecology of the North Sea. Limnology and Oceanography 53: 1805-1815.
Kirby, R. R., Beaugrand, G., Lindley, J. A., Richardson, A. J., Edwards, M. and Reid, P. C. (2007). Climate effects and benthic–pelagic coupling in the North Sea. Marine Ecology Progress Series 330: 31-38.
Kutti, T., Windsland ,K., Broms, C., Falkenhaug, T., Biuw, M., Thangstad, T. H. and Bergstad, O. A. (2019). Seamounts in the OSPAR maritime area-from species to ecosystems. Rapport fra havforskningen.
Lefebvre, A. and Devreker, D. (2020). First Comprehensive Quantitative Multi-Parameter Assessment of the Eutrophication Status from Coastal to Marine French Waters in the English Channel, the Celtic Sea, the Bay of Biscay, and the Mediterranean Sea. Journal of Marine Science and Engineering, 8(8), 561.
Mayor, D. J., Sommer, U., Cook, K. B. and Viant M. R. (2015). The metabolic response of marine copepods to environmental warming and ocean acidification in the absence of food. Scientific Reports, 5(1), 1-12.
McQuatters-Gollop, A., Guerin, L., Arroyo, N. L., Aubert, A., Artigas, L. F., Bedford, J. and Vina-Herbon, C. (2022). Assessing the state of marine biodiversity in the Northeast Atlantic. Ecological Indicators, 141, 109148.
McQuatters-Gollop, A., D. E. Raitsos, M. Edwards and M. J. Attrill. (2007). Spatial patterns of diatom and dinoflagellate seasonal cycles in the NE Atlantic Ocean. Marine Ecology Progress Series 339: 301-306.
Melle W., Ellertsen B. and Skjoldal HR. (2004). In: The Norwegian Sea Ecosystem, H. R. Skjoldal (ed.). Tapir academic press. Trondheim.
Pedersen, S. A., Håkedal, O. J., Salaberria, I., Tagliati, A., Gustavson, L. M., Jenssen, B. M. and Altin, D. (2014). Multigenerational exposure to ocean acidification during food limitation reveals consequences for copepod scope for growth and vital rates. Environmental Science & Technology, 48(20), 12275-12284.
Richirt, J., Goberville, E., Ruiz-Gonzalez, V. and Sautour, B. (2019). Local changes in copepod composition and diversity in two coastal systems of Western Europe. Estuarine, Coastal and Shelf Science, 227, 106304.
Riemann, B., J. Carstensen, K. Dahl, H. Fossing, J. W. Hansen, H. H. Jakobsen, A. B. Josefson, D. Krause-Jensen, S. Markager and P. A. Stæhr. (2016). Recovery of Danish coastal ecosystems after reductions in nutrient loading: a holistic ecosystem approach. Estuaries and Coasts 39: 82-97.
Rijnsdorp, A. D., Peck, M. A., Engelhard, G. H., Möllmann, C and Pinnegar, J. K. (2009). Resolving the effect of climate change on fish populations. ICES journal of marine science 66: 1570-1583.
Romero, E., Garnier, J., Lassaletta, L., Billien, G., Le Gendre, R. and Riou, P. (2013). Largescale patterns of river inputs in southwestern Europe: seasonal and interannual variations and potential eutrophication effects at the coastal zone. Biogeochemistry 113, 481.
Rossby, T. 1996. The North Atlantic Current and surrounding waters: At the crossroads. Reviews of Geophysics 34: 463-481.
Santos, F., Gómez-Gesteira, M., DeCastro, M. and Álvarez, I. (2011). Upwelling along the western coast of the Iberian Peninsula: dependence of trends on fitting strategy. Climate Research, 48(2-3), 213-218.
Schmidt, K., Birchill, A. J., Atkinson, A., Brewin, R. J., Clark, J. R., Hickman, A. E., Johns, D. G., Lohan, M. C., Milne, A. and Pardo, S. (2020). Increasing picocyanobacteria success in shelf waters contributes to long‐term food web degradation. Global Change Biology 26: 5574-5587.
Skogen, M. D., Søiland, H. and Svendsen, E. (2004). Effects of changing nutrient loads to the North Sea. Journal of Marine Systems, 46(1-4), 23-38.
Sousa, M. C., Ribeiro, A., Des, M., Gomez-Gesteira, M., deCastro, M. and Dias, J. M. (2020). NW Iberian Peninsula coastal upwelling future weakening: Competition between wind intensification and surface heating. Science of the Total Environment, 703, 134808.
Spilling, K., Olli, K., Lehtoranta, J., Kremp. A., Tedesco, L., Tamelander,T., Klais, R., Peltonen, H. and Tamminen, T. (2018). Shifting diatom—dinoflagellate dominance during spring bloom in the Baltic Sea and its potential effects on biogeochemical cycling. Frontiers in Marine Science 5: 327.
Stige, LC., Eriksen, E., Dalpadado P. and Kotaro O. (2019). Direct and indirect effects of sea ice cover on major zooplankton groups and planktivorous fishes in the Barents Sea. ICES Journal of Marine Science, in press. https://doi.org/10.1093/icesjms/fsz063
van Beusekom, J. E., Loebl, M. and Martens, P. (2009). Distant riverine nutrient supply and local temperature drive the long-term phytoplankton development in a temperate coastal basin. Journal of Sea Research, 61(1-2), 26-33.
van der Molen, J. and Pätsch, J. (2022). An overview of Atlantic forcing of the North Sea with focus on oceanography and biogeochemistry. Journal of Sea Research, 102281.
Van der Zande, D., Eleveld, M., Lavigne, H., Gohin, F., Pardo, S., Tilstone, G., Blauw, A., Markager, S. and Enserink, L.. (2019). Joint Monitoring Programme of the EUtrophication of the NOrthSea with SATellite data user case. Journal Of Operational Oceanography 12.
Vehmaa, A., Almén, A. K., Brutemark, A., Paul, A., Riebesell, U., Furuhagen, S. and Engström-Öst, J. (2016). Ocean acidification challenges copepod phenotypic plasticity. Biogeosciences, 13(22), 6171-6182.
Woodd-Walker, R. S., Ward, P. and Ward, A. (2002). Large-scale patterns in diversity and community structure of surface water copepods from the Atlantic Ocean. Marine Ecology Progress Series 236: 189-203.
Xiao, W., Liu, X., Irwin, A. J., Laws, E. A., Wang, L., Chen, B., Zeng, Y. and Huang, B.. (2018). Warming and eutrophication combine to restructure diatoms and dinoflagellates. Water research 128: 206-216.
| Pressures | Impact |