

Pressures from underwater noise
Continuous and impulsive noise fall under the pressure category ‘Input of anthropogenic sound (impulsive, continuous)’.
The Quality Status Report 2010 (QSR 2010) discussed noise in qualitative terms, as quantified data on noise was scarce at that time. It noted that human activities producing noise were particularly intense in the Greater North Sea and the Celtic Seas. Trends in human activities have varied since QSR 2010 (see Activities section above), and do not permit a quantitative or qualitative assessment of the changes in overall noise levels since then. Initial data on activities producing impulsive noise in 2015 were presented in the Intermediate Assessment 2017 .
More recently, indicators on noise have been developed by OSPAR. Pressure from continuous noise is covered by OSPAR’s Candidate Indicator on Pressure from Ambient Noise . Pressure from impulsive noise is covered by OSPAR’s Common Indicator for the Pressure from Impulsive Noise . It is not yet possible to establish significant trends from these indicators.
More detail of the methodologies used is given in the respective Indicator Assessments, and readers should refer to these documents if they require further information.
Pressure from continuous noise
Natural ambient sound (e.g. from wind, rain and waves) is omnipresent in the marine environment. This is added to by noise from human activities – in the OSPAR Maritime Area, predominantly from shipping.
In 2015, OSPAR agreed a monitoring strategy for ambient underwater noise (Agreement 2015-05). Monitoring is to be undertaken at acoustic basin scale. In the Greater North Sea, monitoring is carried out under the EU-funded JOMOPANS project (JOMOPANS monitoring does not include the English Channel). Results from this programme are presented in OSPAR’s Candidate Indicator on Pressure from Ambient Noise. The EU-funded JONAS project is developing monitoring for the Bay of Biscay and Iberian Coast, but results of that work are not yet available to inform the Candidate Indicator. OSPAR’s North-East Atlantic Environmental Strategy 2030 (NEAES 2030) includes a commitment for OSPAR to develop and implement, by 2022, a coordinated monitoring programme for continuous sound, to support an assessment of anthropogenic underwater noise in the OSPAR Maritime Area (NEAES Operational Objective S8.02).
The detailed assessment methods are described in the CEMP Guidelines for the Candidate Indicator on ambient underwater noise (OSPAR Agreement 2021-05). The methods are consistent with the 2014 Monitoring Guidance for Underwater Noise in European Seas produced by the EU’s MSFD Technical Subgroup on Underwater Noise (TG-Noise), and are considered consistent with the ongoing further development of the TG-Noise assessment methodology.
The assessment approach uses the median sound pressure level as the metric for evaluation, as it is robust and not overly influenced by short periods of very high sound levels. It uses the noise frequency band 125 Hz 1/3-octave band, which contains the major noise levels caused by shipping noise. As yet, the assessment method does not include sources other than shipping and fishing vessels with automatic identification or vessel monitoring systems.
Background underwater sound levels (without anthropogenic contribution) across the North Sea are approximately 90 dB re 1 µPa median sound pressure level (SPL) for the 125 Hz band. Winter levels are slightly higher (about 5 dB) than summer values, due to windier conditions in winter.

Figure P.1: median total sound pressure level, 2019, measured in 125 Hz band
Figure P.1 shows the overall median sound pressure level across 2019, from natural and anthropogenic sources combined. This was considerably higher in the southern part of the North Sea and along major shipping routes, with an increase in background levels of 20 to 30 dB re 1 µPa, most of the time. The central part of the North Sea was less affected by anthropogenic noise: the median SPL was less than 10 dB re 1 µPa above the background level. In all areas, there was relatively little variation in total sound pressure across the year, although levels of noise in the summer months were a few dB higher than in winter, reflecting increased shipping activity.
The median sound pressure levels obtained by modelling have been validated with the site-based measurements of the JOMOPANS project. The model underestimated noise levels (relative to the field measurements) at low frequencies (< 50 Hz) either under - or overestimated noise levels at mid-frequencies (100 – 1000 Hz), depending on the noise monitoring station concerned, and had comparatively low uncertainty at high frequencies (> 1 kHz). Discrepancies appear to be caused by a combination of factors. The validation process highlighted the complexity of the analysis and the limitations in both the field measurements and the acoustic modelling which could be improved upon in the future.
Pressure from impulsive noise
Impulsive underwater noise is monitored by OSPAR Contracting Parties according to EU technical guidance (adopted as OSPAR Guidelines under OSPAR Agreement 2014-08) and an associated reporting format (OSPAR Agreement 2014-10). Since it is not always possible to comprehensively monitor impulsive noise in the marine environment itself, common monitoring is done through data held on activities causing low- and mid-frequency impulsive noise. Information on impulsive noise events is held in the Impulsive Noise Register, maintained for OSPAR by the International Council for the Exploration of the Sea (ICES).
OSPAR Contracting Parties provide data for the register within the framework of OSPAR monitoring. Between 2015 and 2019, data were reported in five sound source categories: seismic airgun surveys; pile driving; explosions; sonar and acoustic deterrents; and generic, including sources such as non-airgun seismic surveys and noise where the source type was not recorded. Information is not complete, as data were not available for all activities and Contracting Parties during the assessment period. For example, no Norwegian data were included before 2019, and there are no data from Spain or Iceland. Nor did the data include activities which do not require a licence, such as some ADDs.
This information has been used to inform the OSPAR Common Indicator for the Pressure from Impulsive Noise. This is based on so-called ‘pulse block days’ - the number of days in a calendar year that anthropogenic impulsive sound (pulse) occurred within a specified area (block). The spatial area used is the ICES statistical sub-rectangle (‘ICES sub-block’ - 10’ latitude x 20’ longitude), providing detailed resolution at the regional scale. Only impulsive sounds above a minimum intensity are included, above which the risk of impact on marine animals is judged to be significant.
The indicator does not at this stage take account of actual sound intensity, as this information is only available for some activities. Work to improve the reporting of sound intensity is ongoing. Nor does the information reported in the registry take account of the duration of an activity within a pulse block day.
The total of pulse block days reported for each OSPAR region between 2015 and 2019 is shown in Figure P.2 below. The highest level of reported activity was in 2019, when Norwegian seismic airgun activity was included for the first time. The higher level of activity in the Wider Atlantic in 2017 was due to seismic airgun activity. A definitive trend in noise activity cannot be determined because of the incompleteness of the data set. More consistent reporting in future years should result in improved confidence in the comprehensiveness of assessments.
Figure P.2: Total Pulse Block Days per OSPAR Region reported for 2015-2019.
Key message from indicator assessment
Reported impulsive noise activity increased overall during the assessment period (2015-2019), with most reported activity occurring in the North Sea. Seismic airgun surveys were the dominant sound source. Since data are unavailable for some countries and sound sources, these results represent an under-estimation of activity in the OSPAR Area.
Information on the source of activities giving rise to impulsive noise is shown in Figure P.3. The most common source was seismic airgun surveys. The second most frequent category, ‘generic’, is thought to be dominated by sub-bottom profiler geophysical surveys. Pile driving occurred across the period; the low levels for 2019 may be due to incomplete reporting, given the continued increase in offshore renewable energy capacity in that year. Reported explosions were concentrated in the Southern North Sea due to the destruction of unexploded ordnance. Within the ADD / sonar category, most of the reported activity is understood to be military sonar activity.
Figure P.3: Activity type of Pulse Block Days reported for 2015-2019 in each OSPAR Region
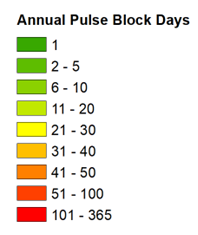
The distribution and frequency of pulse block days in the OSPAR Maritime Area is illustrated in Figure P.4. It can change markedly between years. For example, the maps for 2015 and 2016 show the noise from a large-scale seismic airgun survey carried out in UK waters in those years by the United Kingdom Oil and Gas Authority.
Total Pulse Block Days reported for 2015. Available at: ODIMS
Total Pulse Block Days reported for 2018. Available at: ODIMS
Total Pulse Block Days reported for 2016. Available at: ODIMS
Total Pulse Block Days reported for 2019. Available at: ODIMS
Total Pulse Block Days reported for 2017. Available at: ODIMS
Figure P.4: Total Pulse Block Days reported for 2015-2019 per ICES sub-rectangle
Confidence assessment for pressure from continuous and impulsive noise
A combined regional confidence assessment of the level of evidence and degree of agreement of the underlying assessment methodology for pressure from continuous and impulsive noise is given below. The confidence assessment reflects the fact that data on noise, and on activities which produce noise, are more developed for the Greater North Sea than for other OSPAR regions.
| OSPAR Region | Arctic Waters (Region I) | Greater North Sea (Region II) | Celtic Seas (Region III) | Bay of Biscay and Iberian Coast (Region IV) | Wider Atlantic (Region V) |
|---|---|---|---|---|---|
| Confidence | Low | Medium | Low | Low | Low |
| Activities | State |